Filter
Top 5 Bullish Candlestick Patterns
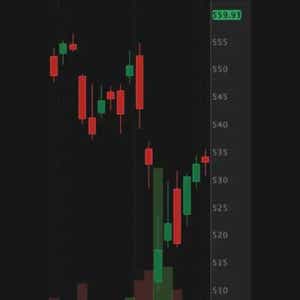
What is a candlestick pattern?
In the context of the financial markets, a candlestick pattern is a visual representation of price movement, displayed on a chart as a series of candlesticks. Originating from Japanese rice traders in the 18th century, candlestick patterns have become foundational tools for technical analysis in the financial markets. Investors and traders value candlestick patterns because of their ability to convey complex market data in a simple format, allowing market participants to see at a glance whether the market is bullish or bearish, as well as the relative strength of the associated price movement.
Ultimately, candlestick patterns are used by traders and analysts to predict future price movements based on past behavior. These patterns can signify potential reversals or continuations in the market's direction, providing critical insights into market sentiment and momentum. Many market participants use candlestick patterns to improve their decision-making process. For example, by using them to guide their trade entry/exit decisions.
How to read a candlestick pattern?
At a high level, each candlestick encapsulates the open, high, low, and close prices within a specified time period, such as a minute, hour, day, or week. However, to read a candlestick pattern, it’s critical to first understand the basic components of a candlestick.
For example, the body of the candlestick represents the difference between the opening and closing prices, while the wicks (or shadows) extend from the body to indicate the high and low prices during that period. The color or shading of the candlestick body typically reflects whether the price closed higher (bullish) or lower (bearish) than it opened.
For instance, if the closing price is higher than the opening price, the body is typically colored or shaded in a way that indicates bullish movement, often in green or white. Conversely, if the closing price is lower than the opening price, the body is usually colored to signify a bearish movement, often in red or black.
By examining the size and position of the body and wicks, traders can glean insights into market sentiment. For example, a long body indicates strong buying or selling pressure, while long wicks suggest market indecision or a potential reversal. Reading candlestick patterns involves recognizing these elements and understanding how their variations combine to form patterns that suggest potential future price movements.
Top bullish candlestick patterns
Bullish candlestick patterns are formations that suggest the price of a security may rise. As such, bullish candlestick patterns are commonly used to identify potential entry points for long positions
Some of the most common bullish patterns include:
Hammer: A single candlestick with a small body and a long lower shadow, indicating that buyers are stepping in after a period of selling pressure.
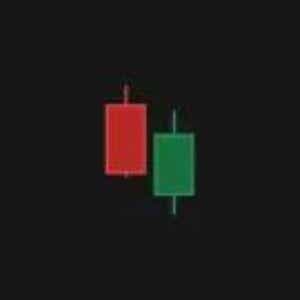
Bullish Engulfing: A two-candlestick pattern where a small bearish candlestick is followed by a larger bullish candlestick that completely engulfs the previous candle's body.
Morning Star: A three-candlestick pattern that starts with a long bearish candlestick, followed by a small-bodied candlestick (indicating indecision), and then a long bullish candlestick, signaling the start of an uptrend.
Piercing Line: A two-candlestick pattern where a bearish candle is followed by a bullish candle that opens lower but closes more than halfway up the previous candle, suggesting a potential reversal.
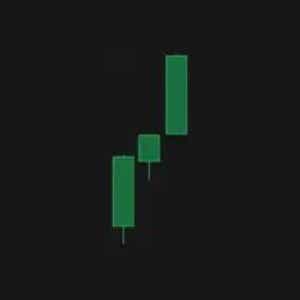
Three White Soldiers: A pattern consisting of three consecutive long-bodied bullish candlesticks, each closing higher than the previous one, indicating strong buying momentum.
Hammer
The hammer is a bullish candlestick pattern that typically appears after a downtrend and signals a potential reversal. It features a small real body at the upper end of the trading range, with little to no upper wick, and a long lower shadow at least twice the length of the body. This shape suggests that sellers initially drove the price down during the trading session, but buyers stepped in, pushing the price back up to near the opening level by the close.
The hammer's significance is amplified when it forms near a key support level, as it indicates that the level is holding and buyers are gaining strength. Volume plays a crucial role in validating the hammer; higher-than-average volume during its formation strengthens the likelihood of a true reversal.

Bullish Engulfing
The bullish engulfing pattern consists of two candlesticks and signals a potential reversal at the end of a downtrend. The first candle is bearish, reflecting continued selling pressure, while the second candle is bullish and completely engulfs the body of the first, meaning it opens lower and closes higher. This engulfing action indicates a shift in momentum from sellers to buyers.
The larger the engulfing candle and the smaller the preceding candle, the more significant the reversal signal. If this pattern occurs at a key support level, it adds to the strength of the potential reversal. Additionally, if the second candle's close is accompanied by strong volume, it further confirms the bullish sentiment and increases the likelihood of a sustained upward movement.

Morning Star
The morning star is a three-candlestick pattern that suggests a potential bullish reversal after a downtrend. It begins with a long bearish candlestick, indicating strong selling pressure. The second candle is typically a small-bodied candle, which can be bullish or bearish, and represents indecision in the market. The final candle is a long bullish candlestick that closes well into the body of the first candle, signaling that buyers have taken control and a reversal is likely underway.
The morning star is most effective when the third candle opens with a gap up and closes near or above the midpoint of the first candle, especially if accompanied by increasing volume. This pattern is particularly strong when it appears near a key support level, as it suggests that the downtrend is losing momentum and a new uptrend may be beginning.

Piercing Line
The piercing line pattern is another two-candlestick formation that appears at the end of a downtrend, signaling a potential reversal. The first candlestick is bearish, reflecting continued downward pressure, followed by a bullish candlestick that opens below the previous day's low but closes more than halfway up the body of the first candlestick. This pattern indicates that the market sentiment is shifting from bearish to bullish.
The deeper the second candle penetrates into the first candle's body, the more reliable the pattern is as a reversal signal. The piercing line pattern's effectiveness increases when it occurs at a significant support level, where it shows that buyers are stepping in to absorb selling pressure and push prices higher. A confirmation of this pattern is often sought in the form of a higher close in the next session, especially if accompanied by rising volume.
Three White Soldiers
The three white soldiers pattern is a strong bullish reversal pattern that consists of three consecutive long-bodied bullish candlesticks. Each candle opens within the previous candle's body and closes progressively higher, indicating sustained buying pressure and a shift in market sentiment from bearish to bullish. This pattern is particularly powerful when it follows a downtrend, as it suggests that buyers have decisively taken control, reversing the prior trend.
The absence of significant wicks on these candles indicates that each session's closing price was near the day's high, underscoring the strength of the bullish momentum. The three white soldiers pattern is even more reliable when it forms near a key support level or when confirmed by rising volume, suggesting a strong, sustained reversal. However, traders should also be cautious of potential overbought conditions if the pattern is accompanied by an exceptionally sharp price increase.
Additional considerations when using candlesticks and associated patterns
When analyzing and utilizing candlestick patterns, there are several key considerations that market participants should keep in mind, as highlighted below:
Volume: Volume is an essential factor in candlestick analysis. Patterns accompanied by higher-than-average volume are typically viewed as more likely to be significant. For example, a bullish engulfing pattern with strong volume suggests more conviction behind the move.
Support and Resistance: Candlestick patterns that form near key levels of support or resistance are often viewed as more significant. For example, a bullish pattern forming near a key support level could indicate that the level is more likely to hold, leading to a potential price increase.
Trend Context: Candlestick patterns are more reliable when analyzed in the context of the overall trend. For instance, bullish patterns are more meaningful at the end of a downtrend or during a pullback in an uptrend.
Trend Confirmation: A pattern should ideally be confirmed by subsequent price action. For example, a bullish pattern is more reliable if it is followed by a higher close in the next session. Waiting for confirmation reduces the risk of false signals.
Pattern Length: Not all candlestick patterns necessarily carry the same weight. Patterns that develop over multiple periods (e.g., three white soldiers) tend to be more reliable than single-candle patterns (e.g., hammer), as they show sustained buying or selling pressure.
Leveraging Multiple Indicators: Candlestick analysis can be more effective when integrated with additional technical indicators, such as moving averages and/or the Relative Strength Index (RSI). Combining these tools provides a more comprehensive view of the market, helping to confirm trends and reduce the likelihood of false signals. When multiple indicators align, it theoretically strengthens the validity of the trend, and enhances the reliability of the analysis.
Potential limitations of candlestick pattern analysis
Candlestick patterns, while useful for identifying potential market trends, have limitations due to their reliance on past price data, which may not accurately predict future movements.
As a result, candlestick patterns can generate false signals, especially in volatile or low-volume markets, and their effectiveness often depends on context, such as the overall trend and the timeframe being analyzed.
Additionally, candlestick patterns should not be used in isolation. They are most effective when combined with other technical indicators and market analysis tools, which all together provide a more comprehensive view of market conditions and sentiment.
tastylive content is created, produced, and provided solely by tastylive, Inc. (“tastylive”) and is for informational and educational purposes only. It is not, nor is it intended to be, trading or investment advice or a recommendation that any security, futures contract, digital asset, other product, transaction, or investment strategy is suitable for any person. Trading securities, futures products, and digital assets involve risk and may result in a loss greater than the original amount invested. tastylive, through its content, financial programming or otherwise, does not provide investment or financial advice or make investment recommendations. Investment information provided may not be appropriate for all investors and is provided without respect to individual investor financial sophistication, financial situation, investing time horizon or risk tolerance. tastylive is not in the business of transacting securities trades, nor does it direct client commodity accounts or give commodity trading advice tailored to any particular client’s situation or investment objectives. Supporting documentation for any claims (including claims made on behalf of options programs), comparisons, statistics, or other technical data, if applicable, will be supplied upon request. tastylive is not a licensed financial adviser, registered investment adviser, or a registered broker-dealer. Options, futures, and futures options are not suitable for all investors. Prior to trading securities, options, futures, or futures options, please read the applicable risk disclosures, including, but not limited to, the Characteristics and Risks of Standardized Options Disclosure and the Futures and Exchange-Traded Options Risk Disclosure found on tastytrade.com/disclosures.
tastytrade, Inc. ("tastytrade”) is a registered broker-dealer and member of FINRA, NFA, and SIPC. tastytrade was previously known as tastyworks, Inc. (“tastyworks”). tastytrade offers self-directed brokerage accounts to its customers. tastytrade does not give financial or trading advice, nor does it make investment recommendations. You alone are responsible for making your investment and trading decisions and for evaluating the merits and risks associated with the use of tastytrade’s systems, services or products. tastytrade is a wholly-owned subsidiary of tastylive, Inc.
tastytrade has entered into a Marketing Agreement with tastylive (“Marketing Agent”) whereby tastytrade pays compensation to Marketing Agent to recommend tastytrade’s brokerage services. The existence of this Marketing Agreement should not be deemed as an endorsement or recommendation of Marketing Agent by tastytrade. tastytrade and Marketing Agent are separate entities with their own products and services. tastylive is the parent company of tastytrade.
tastyfx, LLC (“tastyfx”) is a Commodity Futures Trading Commission (“CFTC”) registered Retail Foreign Exchange Dealer (RFED) and Introducing Broker (IB) and Forex Dealer Member (FDM) of the National Futures Association (“NFA”) (NFA ID 0509630). Leveraged trading in foreign currency or off-exchange products on margin carries significant risk and may not be suitable for all investors. We advise you to carefully consider whether trading is appropriate for you based on your personal circumstances as you may lose more than you invest.
tastycrypto is provided solely by tasty Software Solutions, LLC. tasty Software Solutions, LLC is a separate but affiliate company of tastylive, Inc. Neither tastylive nor any of its affiliates are responsible for the products or services provided by tasty Software Solutions, LLC. Cryptocurrency trading is not suitable for all investors due to the number of risks involved. The value of any cryptocurrency, including digital assets pegged to fiat currency, commodities, or any other asset, may go to zero.
© copyright 2013 - 2026 tastylive, Inc. All Rights Reserved. Applicable portions of the Terms of Use on tastylive.com apply. Reproduction, adaptation, distribution, public display, exhibition for profit, or storage in any electronic storage media in whole or in part is prohibited under penalty of law, provided that you may download tastylive’s podcasts as necessary to view for personal use. tastylive was previously known as tastytrade, Inc. tastylive is a trademark/servicemark owned by tastylive, Inc.
Your privacy choices