Filter
Top 5 Bearish Candlestick Patterns
What is a candlestick pattern?
In the financial markets, a candlestick pattern is a graphical representation of price movements, depicted on a chart as a series of candlesticks. These patterns, which trace their origins to Japanese rice traders in the 18th century, have evolved into essential tools for technical analysis in today’s trading landscape. Traders and investors appreciate candlestick patterns for their ability to simplify complex market data, allowing for quick interpretations of whether the market is exhibiting bullish or bearish behavior and the intensity of the price movement.
Candlestick patterns are particularly effective for forecasting future price movements based on historical trends. They can signal potential market reversals or continuations, providing valuable insights into the prevailing market sentiment and momentum. For example, bearish candlestick patterns are crucial for traders seeking to anticipate downward movements, helping them make more informed decisions about when to enter or exit trades. By incorporating these patterns into their analysis, traders can refine their decision-making processes, using the patterns as a tool to better time their market entries and exits.
How to read a candlestick pattern?
At a basic level, each candlestick encapsulates the open, high, low, and close prices for a specific time frame, such as a minute, hour, day, or week. However, to accurately interpret a bearish candlestick pattern, it’s essential to first grasp the fundamental components of a candlestick.
The body of the candlestick represents the range between the opening and closing prices, while the wicks (or shadows) extend from the body to indicate the highest and lowest prices reached during that period. In the context of bearish patterns, the color or shading of the candlestick body typically reflects whether the price closed lower than it opened.
For instance, if the closing price is lower than the opening price, the body is generally colored to signify bearish movement, commonly in red or black. This visual cue indicates that sellers were dominant during that period, pushing the price down.
By analyzing the size and position of the body and wicks, traders can derive insights into bearish market sentiment. A long body in a bearish candlestick, for example, suggests strong selling pressure, while long wicks can indicate market indecision or a potential reversal. Understanding bearish candlestick patterns involves recognizing these components and how their variations combine to create patterns that may signal future downward price movements.
top bearish candlestick patterns
Bearish candlestick patterns are formations that suggest the price of a security may fall. As such, these patterns are commonly used to identify potential entry points for short positions or to signal the exit of long positions.
Some of the most common bearish patterns include:
Shooting Star: A single candlestick with a small body and a long upper shadow, indicating that sellers have taken control after an initial buying surge, potentially signaling a reversal at the top of an uptrend.
Bearish Engulfing: A two-candlestick pattern where a small bullish candlestick is followed by a larger bearish candlestick that completely engulfs the previous candle's body, suggesting a shift in momentum to the downside.
Evening Star: A three-candlestick pattern that begins with a long bullish candlestick, followed by a small-bodied candlestick (indicating indecision), and then a long bearish candlestick, signaling the potential start of a downtrend.
Dark Cloud Cover: A two-candlestick pattern where a bullish candle is followed by a bearish candle that opens higher but closes more than halfway down the previous candle, indicating that sellers are beginning to dominate.
Three Black Crows: A pattern consisting of three consecutive long-bodied bearish candlesticks, each closing lower than the previous one, indicating strong selling momentum and a potential reversal of an uptrend.
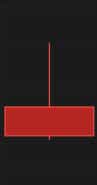
1) Shooting Star
The shooting star is a bearish candlestick pattern that typically appears after an uptrend and signals a potential reversal. It is characterized by a small real body near the lower end of the trading range, with a long upper shadow that is at least twice the length of the body, and little to no lower shadow. This formation suggests that the market opened higher, rallied during the session, but then faced strong selling pressure that drove the price back down near the opening level by the close.
The long upper shadow indicates that the initial bullish momentum was met with significant resistance, potentially marking the end of the uptrend. The shooting star's effectiveness as a reversal signal increases if it forms at or near a key resistance level, especially if accompanied by high trading volume, indicating that sellers are beginning to dominate.
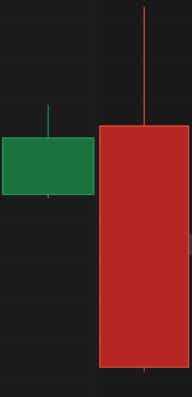
2) Bearish Engulfing
The bearish engulfing pattern is a two-candlestick formation that signals a potential bearish reversal, often appearing at the top of an uptrend. The first candle is bullish, reflecting ongoing buying pressure, while the second candle is bearish and completely engulfs the body of the first candle, meaning it opens higher and closes lower. This engulfing action indicates a shift in market sentiment from bullish to bearish, as sellers overwhelm buyers.
The larger the engulfing candle and the smaller the preceding candle, the stronger the reversal signal. This pattern is particularly significant if it occurs near a resistance level, where it suggests that the uptrend may be losing steam and a downward move could follow. Volume is also crucial here; a bearish engulfing pattern with strong volume behind it adds credibility to the signal.
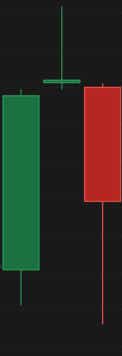
3) Evening Star
The evening star is a three-candlestick pattern that signals a potential bearish reversal at the end of an uptrend. It begins with a long bullish candlestick, indicating continued buying pressure. The second candle is typically a small-bodied candle, which can be bullish or bearish, and represents market indecision. The third candle is a long bearish candlestick that closes well into the body of the first candle, indicating that sellers have taken control and a reversal is likely underway.
The evening star pattern is more potent when the third candle opens with a gap down and closes near or below the midpoint of the first candle, especially if supported by increasing volume. This pattern is most reliable when it appears near a resistance level, suggesting that the upward momentum has stalled and a downtrend may be beginning.
4) Dark Cloud Cover
The dark cloud cover is a two-candlestick pattern that suggests a potential bearish reversal at the end of an uptrend. The first candlestick is bullish, showing continued upward pressure, while the second candlestick opens above the previous day's high but closes significantly lower, more than halfway down the body of the first candlestick. This pattern indicates a shift in sentiment from bullish to bearish, as the second candle's close below the midpoint of the first candle's body suggests that sellers are beginning to gain control.
The dark cloud cover is more significant if it forms near a key resistance level, where it signals that the upward trend may be running out of steam. Confirmation through a lower close in the next session, particularly with increased volume, further validates the bearish signal.

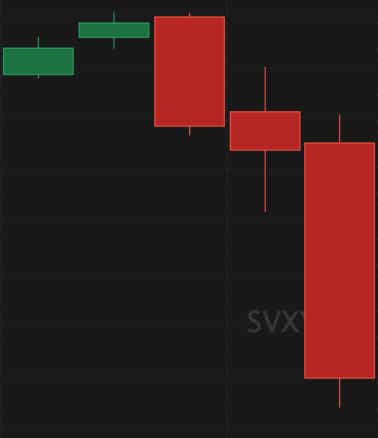
5) Three Black Crows
The three black crows pattern is a strong bearish reversal pattern that consists of three consecutive long-bodied bearish candlesticks. Each candle opens within the previous candle's body and closes progressively lower, indicating sustained selling pressure and a shift in market sentiment from bullish to bearish. This pattern is particularly powerful when it follows an uptrend, as it suggests that sellers have decisively taken control, reversing the prior trend.
The absence of significant lower shadows on these candles indicates that each session's closing price was near the day's low, underscoring the strength of the bearish momentum. The three black crows pattern is even more reliable when it forms near a key resistance level or when confirmed by rising volume, suggesting a strong, sustained reversal. However, traders should also be cautious of potential oversold conditions if the pattern is accompanied by an exceptionally sharp price decrease.
Additional considerations when using candlesticks and associated patterns
When analyzing and utilizing candlestick patterns, there are several key considerations that market participants should keep in mind, as highlighted below:
Volume: Volume plays a crucial role in candlestick analysis. Patterns accompanied by higher-than-average volume are generally seen as more significant. For example, a bearish engulfing pattern with strong volume indicates greater conviction behind the downward move, increasing the likelihood of a sustained decline.
Support and Resistance: Candlestick patterns that form near key levels of support or resistance are often more impactful. For instance, a bearish pattern forming near a key resistance level could signal that the level is likely to hold, potentially leading to a price decrease as selling pressure intensifies.
Trend Context: Bearish candlestick patterns are more reliable when analyzed within the context of the overall trend. These patterns are particularly meaningful at the end of an uptrend or during a pullback in a downtrend, as they may signal a continuation of the downward movement or a reversal from a temporary upward correction.
Trend Confirmation: Ideally, a bearish pattern should be confirmed by subsequent price action. For example, a bearish pattern becomes more reliable if it is followed by a lower close in the next session. Waiting for confirmation helps to reduce the risk of acting on false signals and can provide additional assurance of the pattern's validity.
Pattern Length: Not all candlestick patterns carry the same weight. Patterns that develop over multiple periods, such as the three black crows, tend to be more reliable than single-candle patterns like the shooting star, as they indicate sustained selling pressure rather than a momentary shift in sentiment.
tastylive content is created, produced, and provided solely by tastylive, Inc. (“tastylive”) and is for informational and educational purposes only. It is not, nor is it intended to be, trading or investment advice or a recommendation that any security, futures contract, digital asset, other product, transaction, or investment strategy is suitable for any person. Trading securities, futures products, and digital assets involve risk and may result in a loss greater than the original amount invested. tastylive, through its content, financial programming or otherwise, does not provide investment or financial advice or make investment recommendations. Investment information provided may not be appropriate for all investors and is provided without respect to individual investor financial sophistication, financial situation, investing time horizon or risk tolerance. tastylive is not in the business of transacting securities trades, nor does it direct client commodity accounts or give commodity trading advice tailored to any particular client’s situation or investment objectives. Supporting documentation for any claims (including claims made on behalf of options programs), comparisons, statistics, or other technical data, if applicable, will be supplied upon request. tastylive is not a licensed financial adviser, registered investment adviser, or a registered broker-dealer. Options, futures, and futures options are not suitable for all investors. Prior to trading securities, options, futures, or futures options, please read the applicable risk disclosures, including, but not limited to, the Characteristics and Risks of Standardized Options Disclosure and the Futures and Exchange-Traded Options Risk Disclosure found on tastytrade.com/disclosures.
tastytrade, Inc. ("tastytrade”) is a registered broker-dealer and member of FINRA, NFA, and SIPC. tastytrade was previously known as tastyworks, Inc. (“tastyworks”). tastytrade offers self-directed brokerage accounts to its customers. tastytrade does not give financial or trading advice, nor does it make investment recommendations. You alone are responsible for making your investment and trading decisions and for evaluating the merits and risks associated with the use of tastytrade’s systems, services or products. tastytrade is a wholly-owned subsidiary of tastylive, Inc.
tastytrade has entered into a Marketing Agreement with tastylive (“Marketing Agent”) whereby tastytrade pays compensation to Marketing Agent to recommend tastytrade’s brokerage services. The existence of this Marketing Agreement should not be deemed as an endorsement or recommendation of Marketing Agent by tastytrade. tastytrade and Marketing Agent are separate entities with their own products and services. tastylive is the parent company of tastytrade.
tastyfx, LLC (“tastyfx”) is a Commodity Futures Trading Commission (“CFTC”) registered Retail Foreign Exchange Dealer (RFED) and Introducing Broker (IB) and Forex Dealer Member (FDM) of the National Futures Association (“NFA”) (NFA ID 0509630). Leveraged trading in foreign currency or off-exchange products on margin carries significant risk and may not be suitable for all investors. We advise you to carefully consider whether trading is appropriate for you based on your personal circumstances as you may lose more than you invest.
tastycrypto is provided solely by tasty Software Solutions, LLC. tasty Software Solutions, LLC is a separate but affiliate company of tastylive, Inc. Neither tastylive nor any of its affiliates are responsible for the products or services provided by tasty Software Solutions, LLC. Cryptocurrency trading is not suitable for all investors due to the number of risks involved. The value of any cryptocurrency, including digital assets pegged to fiat currency, commodities, or any other asset, may go to zero.
© copyright 2013 - 2026 tastylive, Inc. All Rights Reserved. Applicable portions of the Terms of Use on tastylive.com apply. Reproduction, adaptation, distribution, public display, exhibition for profit, or storage in any electronic storage media in whole or in part is prohibited under penalty of law, provided that you may download tastylive’s podcasts as necessary to view for personal use. tastylive was previously known as tastytrade, Inc. tastylive is a trademark/servicemark owned by tastylive, Inc.
Your privacy choices