Filter
What is an Options Chain & How to Read it?
What is an options chain?
At a high level, an options chain (also known as a "chain sheet" or “options matrix”) is a comprehensive representation of an options market. Options chains are designed to allow market participants to easily view and analyze the options market. The term "chain" is used because it encompasses a variety of offerings, spanning different strike prices and expiration periods.
The options matrix lists all available options contracts for a specific underlying asset, such as a stock or an ETF. It provides key details for each contract, including strike prices, expiration dates, premiums, bid and ask prices, open interest, volume, and implied volatility. When the market is open, options chains continuously update in real-time.
By examining and monitoring an options chain, market participants can assess the ever-changing dynamics of the market, including liquidity and sentiment. These data points help traders efficiently navigate the market, manage risk, and identify new opportunities. Overall, the options chain is an essential tool for all participants in the options market.
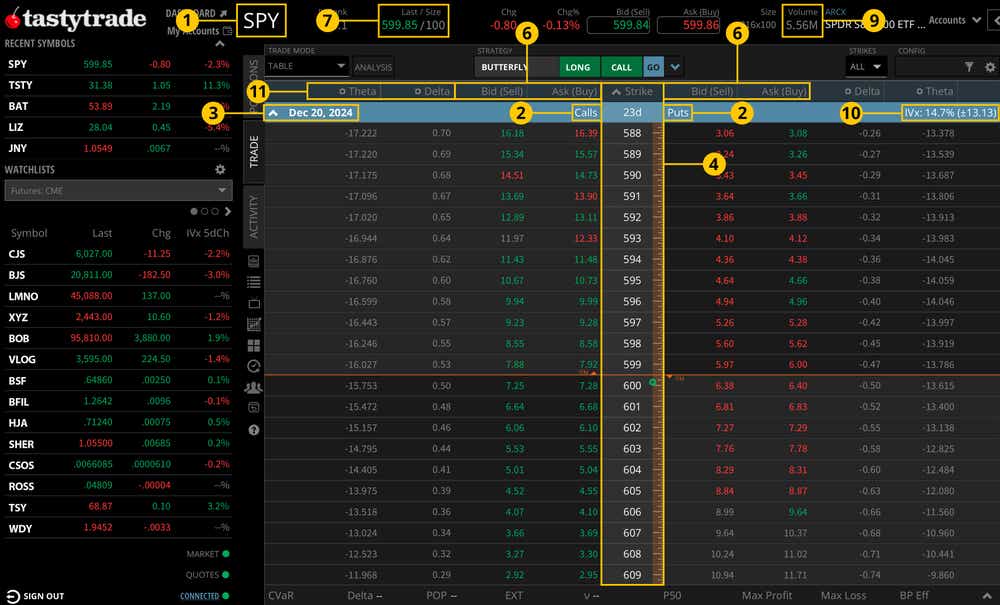
An options chain provides a detailed snapshot of all available options contracts for a specific underlying asset. Key components of an options chain include:
Underlying Asset: The stock or ETF for which the options are listed.
Option Type: Options are either calls or puts.
Expiration Dates: The dates on which the options contracts will expire.
Strike Prices: The prices at which the option holder can exercise their right to buy (call option) or sell (put option) the underlying asset.
Premiums: The market prices (dollar and cents) of the options contracts.
Bid and Ask Prices: The highest price a buyer is willing to pay (bid) and the lowest price a seller is willing to accept (ask) for a given options contract. The so-called “best” bid and offer prices available in the market.
Last Price: The most recent price at which a given option traded hands.
Open Interest: The total number of outstanding contracts that are currently active.
Volume: The number of contracts traded during a specific period, usually the current trading day.
Implied Volatility: A measure of the market's expectations for future volatility of the underlying asset, reflected in the option’s price.
Greeks: The “Greeks” refer to a group of parameters that measure various risks in an options position, such as delta, gamma, theta, vega, and rho.
It should be noted that the exact format of an options matrix can vary across different platforms. However, the information presented in an options matrix is generally consistent and universal.
How to read and options chain
Investors and traders use options chains to analyze and compare options-focused data in order to help make informed decisions.
In that regard, options market participants use the options chain to identify and analyze shifting dynamics in the market. This process helps market participants efficiently manage their existing positions, while also assisting with the identification of new opportunities.
All told, an options chain is somewhat akin to a stock quote, providing essential information about the market. Some tips on reading and understanding options chains are highlighted below:
Identify the Underlying Asset: Start by selecting the options chain for the stock or index you are interested in. Ensure you understand the fundamentals of the underlying asset because this dynamic will influence pricing in the options market.
Choose an Option Type: A put or a call, or potentially a spread position, involving two or more different options positions.
Evaluate Expiration Dates: Look at the various expiration dates available. Near-term options are usually less expensive but more volatile, while longer-term options provide more stability but at a higher cost. Choose an expiration date that aligns with your trading strategy.
Analyze Strike Prices: Review the range of strike prices. Options that are in-the-money (ITM) have intrinsic value and are more expensive, while out-of-the-money (OTM) options are cheaper, but are less likely to expire ITM. At-the-money (ATM) options have strike prices close to the current market price of the underlying asset.
Compare Premiums: Examine the premiums for call and put options at different strike prices and expiration dates. Premiums are influenced by the underlying asset price, time to expiration, implied volatility, dividends and interest rates.
Monitor Open Interest: Open interest refers to the total number of outstanding option contracts that are currently active and have not been settled or closed. As such, open interest provides insight into the liquidity and activity level of a particular option. A high level of option interest can be indicative of better liquidity, and more narrow bid-ask spreads in that option.
Monitor Volume: Volume represents the number of contracts traded in a given period, usually represented as daily trading volume. Ideally, both open interest and daily trading volume are robust, making it theoretically easier to open and close trades in this market.
Monitor Bid and Ask Prices: Assess the bid-ask spread to understand the liquidity of the options. A narrow spread is often indicative of an efficient and liquid market, making it easier to enter and exit positions.
Analyze Implied Volatility: Implied volatility is a key metric used in the options universe derived from options prices that expresses the market’s expectations for future movement in the underlying asset. Participants in the options market often use extremes in implied volatility to make trading decisions, because implied volatility is traditionally mean-reverting. Meaning high levels of implied volatility typically revert lower, toward the long-term average. While low levels of implied volatility often revert higher, toward the long-term average.
Utilize Available Tools: Many platforms offer advanced analytics, charts, and tools to help you make more informed decisions. Participants in the options market should explore these tools, and utilize those that fit their strategy, outlook and risk profile.
Interpreting implied volatility using IV Rank
On the tastytrade platform, options traders can use IV Rank to help interpret prevailing levels of implied volatility for a given option.
In basic terms, Implied Volatility Rank (aka IV Rank or IVR) reports how the current level of implied volatility compares to the last 52 weeks of historical data. As such, IV Rank is presented on a scale between 0-100, where 0 represents the low IV% print for the year, and 100 represents the high IV% print.
Option traders typically use IV Rank to assess whether implied volatility (IV) is high or low in a specific underlying based on the past year of implied volatility data. High levels of implied volatility may signal that an opportunity exists to sell options/volatility, while extremely low levels of implied volatility may signal that an opportunity exists to buy options/volatility.
IV Rank example
Imagine that implied volatility ranged between 30% and 60% during the last 52 weeks in hypothetical stock XYZ. If implied volatility is currently trading at 45%, that would imply that XYZ currently has an implied volatility rank of 50 - because implied volatility is at the exact midpoint of its 52-week range.
Now imagine that implied volatility climbs to 60% in XYZ, which is the top end of the 52-week range. In that scenario, implied volatility rank would now be 100, because that’s the highest level of implied volatility observed over the last year. If implied volatility dropped to 30%, IV rank would then drop to zero.
While other considerations may be taken into account, an implied volatility rank above 50% can be indicative of an attractive opportunity to sell options/volatility, while an implied volatility rank well below 50% can be indicative of an attractive opportunity to buy options/volatility—both due to the mean reverting nature of implied volatility.
Additional tools and metrics to consider
In addition to the aforementioned data and information, the tastytrade platform offers additional metrics and tools that market participants can use to help identify new opportunities, to manage existing positions, and to assess risks at both the position and portfolio level.
© copyright 2013 - 2026 tastylive, Inc.
tastylive content is created, produced, and provided solely by tastylive, Inc. (“tastylive”) and is for informational and educational purposes only. It is not, nor is it intended to be, trading or investment advice or a recommendation that any security, futures contract, digital asset, other product, transaction, or investment strategy is suitable for any person. Trading securities, futures products, and digital assets involve risk and may result in a loss greater than the original amount invested. tastylive, through its content, financial programming or otherwise, does not provide investment or financial advice or make investment recommendations. Investment information provided may not be appropriate for all investors and is provided without respect to individual investor financial sophistication, financial situation, investing time horizon or risk tolerance. tastylive is not in the business of transacting securities trades, nor does it direct client commodity accounts or give commodity trading advice tailored to any particular client’s situation or investment objectives. Supporting documentation for any claims (including claims made on behalf of options programs), comparisons, statistics, or other technical data, if applicable, will be supplied upon request. tastylive is not a licensed financial adviser, registered investment adviser, or a registered broker-dealer. Options, futures, and futures options are not suitable for all investors. Prior to trading securities, options, futures, or futures options, please read the applicable risk disclosures, including, but not limited to, the Characteristics and Risks of Standardized Options Disclosure and the Futures and Exchange-Traded Options Risk Disclosure found on tastytrade.com/disclosures.
tastytrade, Inc. ("tastytrade”) is a registered broker-dealer and member of FINRA, NFA, and SIPC. tastytrade was previously known as tastyworks, Inc. (“tastyworks”). tastytrade offers self-directed brokerage accounts to its customers. tastytrade does not give financial or trading advice, nor does it make investment recommendations. You alone are responsible for making your investment and trading decisions and for evaluating the merits and risks associated with the use of tastytrade’s systems, services or products. tastytrade is a wholly-owned subsidiary of tastylive, Inc.
tastytrade has entered into a Marketing Agreement with tastylive (“Marketing Agent”) whereby tastytrade pays compensation to Marketing Agent to recommend tastytrade’s brokerage services. The existence of this Marketing Agreement should not be deemed as an endorsement or recommendation of Marketing Agent by tastytrade. tastytrade and Marketing Agent are separate entities with their own products and services. tastylive is the parent company of tastytrade.
tastyfx, LLC (“tastyfx”) is a Commodity Futures Trading Commission (“CFTC”) registered Retail Foreign Exchange Dealer (RFED) and Introducing Broker (IB) and Forex Dealer Member (FDM) of the National Futures Association (“NFA”) (NFA ID 0509630). Leveraged trading in foreign currency or off-exchange products on margin carries significant risk and may not be suitable for all investors. We advise you to carefully consider whether trading is appropriate for you based on your personal circumstances as you may lose more than you invest.
tastycrypto is provided solely by tasty Software Solutions, LLC. tasty Software Solutions, LLC is a separate but affiliate company of tastylive, Inc. Neither tastylive nor any of its affiliates are responsible for the products or services provided by tasty Software Solutions, LLC. Cryptocurrency trading is not suitable for all investors due to the number of risks involved. The value of any cryptocurrency, including digital assets pegged to fiat currency, commodities, or any other asset, may go to zero.
© copyright 2013 - 2026 tastylive, Inc. All Rights Reserved. Applicable portions of the Terms of Use on tastylive.com apply. Reproduction, adaptation, distribution, public display, exhibition for profit, or storage in any electronic storage media in whole or in part is prohibited under penalty of law, provided that you may download tastylive’s podcasts as necessary to view for personal use. tastylive was previously known as tastytrade, Inc. tastylive is a trademark/servicemark owned by tastylive, Inc.
Your privacy choices