U.S. Treasury Yield Outlook in Anticipation of Fed Meeting
.jpg?format=pjpg&quality=50&width=1760&disable=upscale&auto=webp)
U.S. Treasury Yield Outlook in Anticipation of Fed Meeting
Yields were a big story in 2022, as an aggressive move by the Federal Reserve to raise benchmark interest rates pushed U.S. Treasury yields to the highest levels since 2008.
However, Treasury yields have pulled back sharply since hitting those highs in late October.
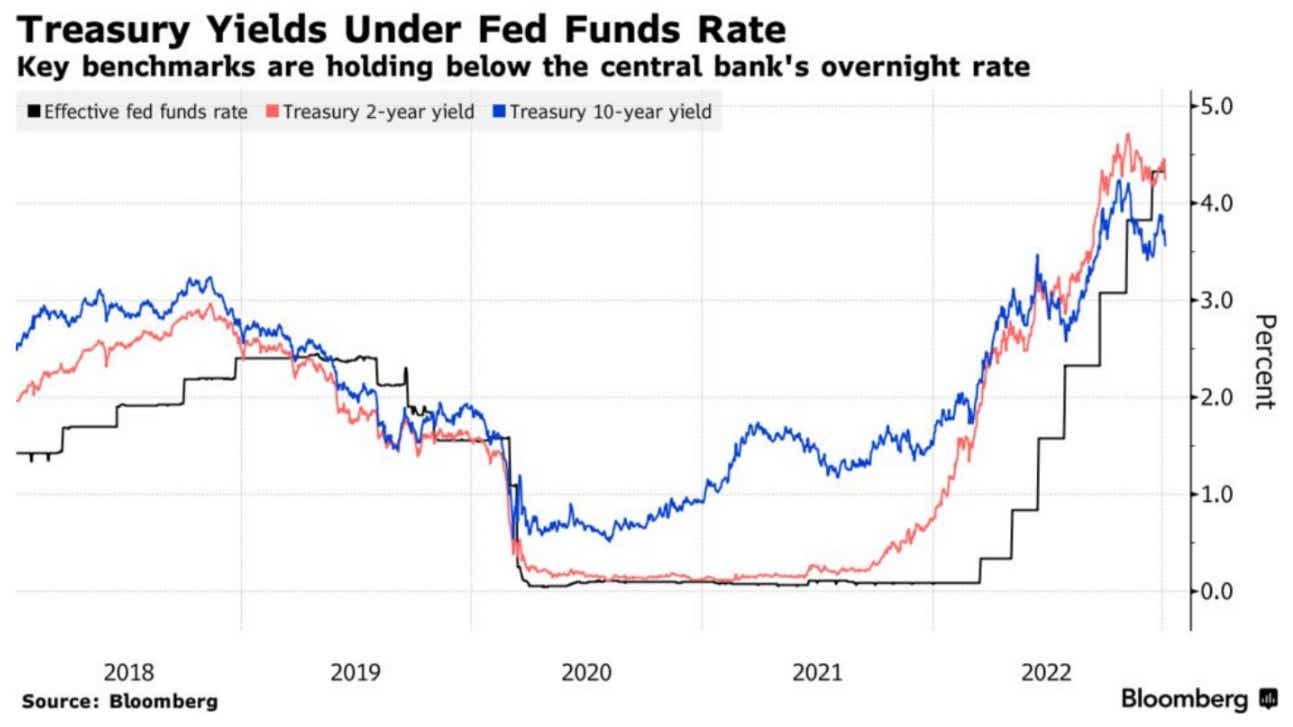
Today, the yield on the 10-year Treasury—the most visible government bond on Earth—is sitting at roughly 3.50%. That's down from a high of about 4.20% in late October.
For reference, the 10-year yield was trading around 1.50% at the start of 2022, as illustrated below.
Yields can move for a variety of reasons, which means these instruments can be a valuable source of information on sentiment in the financial markets.
Last year, yields rallied alongside rising U.S. interest rates. Traditionally, yields and interest rates share a strong, positive correlation.
However, yields are also extremely sensitive to changes in the underlying U.S. economy, or changes to expectations for the underlying economy. And over the last several months, anxieties over a forthcoming U.S. recession have intensified.
The darkening forecast for the U.S. economy has undoubtedly weighed on yields in recent weeks. And where the economy goes from here, will heavily influence the direction of yields in 2023.
Based on feedback from banking executives, the depth and timing of a potential 2023 recession are difficult to predict. That was illustrated quite clearly last week when Jamie Dimon—the longtime CEO of JPMorgan (JPM)—said during the bank’s recent Q4 earnings call, "It may be a mild recession. It may not be."
The flimsiness of that response suggests investors and traders might be better off asking a Magic 8 Ball. But it drives home just how cloudy the current forecast is for the U.S. economy, as well as the forecast for yields.
Federal Reserve Set to Meet January 31
Another important factor to consider is that the Federal Reserve will meet for the first time in 2023 from January 31 to February 1. At that meeting, U.S. central bankers will decide whether to raise benchmark interest rates further, and by how much.
Several months ago, most pundits expected that the Fed would raise rates by another half percentage point during the January meeting. However, sentiment has shifted in recent weeks, and most analysts now assign an equal probability to the chance for a quarter-point hike.
The market tends to take cues from leaders at the Federal Reserve when building these expectations, and recent remarks by Susan Collins—the president of the Federal Reserve Bank of Boston—appear to have strongly influenced expectations for the next rate hike.
Last week, Ms. Collins told The New York Times, "I think 25 or 50 would be reasonable; I'd lean at this stage to 25, but it's very data-dependent." Ms. Collins is one of the 12 regional Fed presidents, and one of the 19 primary policymakers.
Forthcoming decisions by the Fed, as well as the health of the underlying U.S. economy, will be a couple of the most important determinants for yields in Q1 2023.
U.S. Yield Curve Still Inverted
Importantly, the overall shape of the U.S. yield curve also suggests that a recession could develop at some point in 2023.
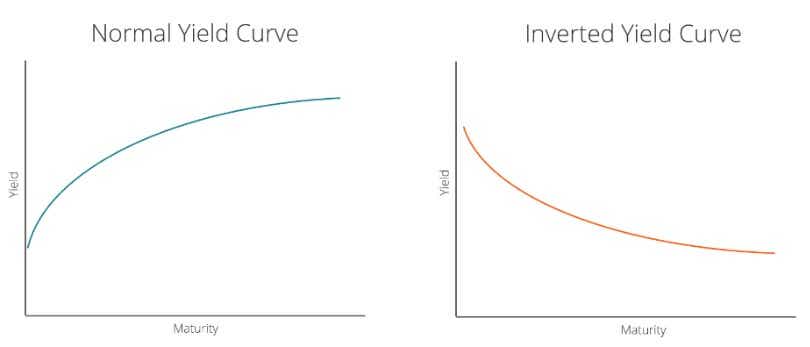
The yield curve represents a timeline of interest rates across a range of different maturities on U.S. government debt (i.e. 2-year, 10-year, 30-year), and is typically presented in chart form.
A "normal" yield curve is usually described by a gradually rising line going from left to right on the chart—meaning interest rates rise as one goes further out in time. On the other hand, a so-called “inversion” of the yield curve occurs when short term rates climb higher than longer-term rates—even if only for a brief period.
One of the most closely followed relationships on the yield curve—especially when it comes to inversions—is the relationship between the yields of 2-year government bonds and 10-year government bonds.
An inversion occurs when the yield on 2-year government bonds is greater than the yield on 10-year government bonds. As illustrated below, inversions involving the “2s and 10s” have precipitated the last several major recessions in the United States (periods of economic recession are shaded in grey).
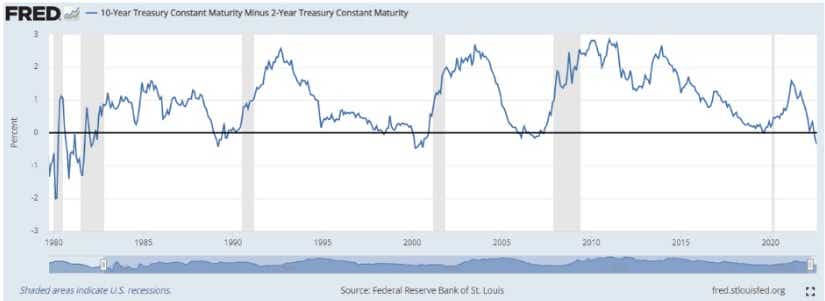
Importantly, the 2s and 10s have been inverted since July of last year. At present, the yield on the 2-year U.S. Treasury is 4.25%, while the yield on the 10-year U.S. Treasury is 3.50%
Generally speaking, longer-term interest rates reflect future expectations for short-term interest rates. So when long-term rates drop below short-term rates (as they are now), that generally means that future expectations for the underlying economy are deteriorating.
Based on the aforementioned information, investors and traders may want to closely follow forthcoming economic data, as well as ongoing changes to yields and the overall yield curve. It’s possible that a clear yields trade could emerge in the coming weeks, which capitalizes upon forthcoming developments.
For more background on the yield curve, readers can check out this installment of Options Jive on the tastylive financial network. This episode of Market Measures—focusing on the historical relationship between the yield curve and the stock market—is also recommended.
To follow everything moving the markets in 2023—including Treasury yields—readers can also monitor tastylive, weekdays from 7 a.m. to 4 p.m. CDT.
Options involve risk and are not suitable for all investors. Please read Characteristics and Risks of Standardized Options before deciding to invest in options.