Step Up Your Strangle Game | Our 3 Favorite Strangle Studies

Step Up Your Strangle Game | Our 3 Favorite Strangle Studies
When watching tastylive, you may hear something like…
“We are selling the strangle with the 16 delta call and 16 delta put so that it is a 1 standard deviation with over 70% POP, when factoring the credit.”
If there's one thing we love discussing at tastylive, it's the good ole' strangle! It has been a more popular topic of discussion lately so we wanted to curate for you, some of the best strangle content that we've produced, in one post (don't say we never did anything for you)!
For those of you that are unfamiliar, selling a strangle is the simultaneous sale of an out of the money (OTM) call, and an OTM put. When we are selling an OTM call, we are selling an option with a strike price above the current price of the underlying, and likewise for the OTM put, we are selling an option with a strike price below the current price.
Some Notes About Trading Strangles...
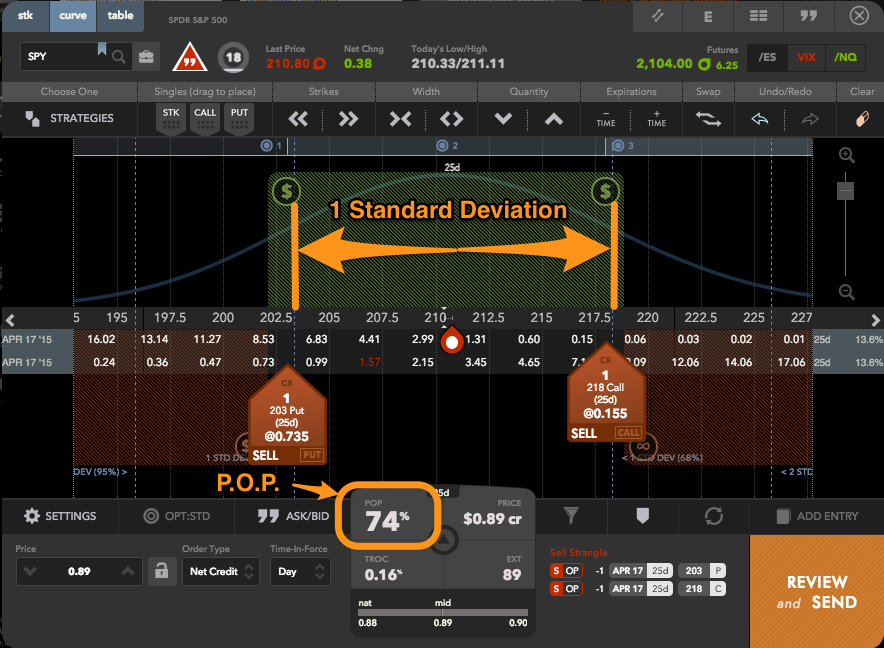
When entering a strangle, we generally have a sense for what probability of profit we are targeting. We target a P.O.P. that is 1 standard deviation away from where the underlying is trading at.
To do this we will sell the 84% OTM call and 84% OTM put, meaning that there is a 16% chance of the underlying moving higher than the call strike, and a 16% chance of it moving lower than the put strike. This equates to a 32% chance of the trade being in-the-money (ITM) at expiration and a 68% chance of the stock price expiring within our strikes (which is 1 standard deviation away from the stock price at trade entry).
If you have a large enough account, a strangle is probably the best strategy if you are looking for a trade with a P.O.P.. Some traders will argue that an Iron Condor offers a higher potential return on capital (ROC) than a strangle, but we have seen time and time again through our studies that strangles perform better because they collect more credit and have a higher probability of profit.
With the credit we receive for placing a strangle factored in, a 1 standard deviation strangle will typically have break-evens that equate to a P.O.P. of 70% (or greater). If we want to have an even higher P.O.P., we can always widen out our strikes on a strangle (which will reduce the max profit and potential return on capital).
Now that we’ve reviewed the basics of what we think about when placing a short a short strangle, let’s take a look at 3 of our best strangle studies we’ve looked at in our Market Measures studies (these are not all of our strangle studies, but definitely some of the most compelling)!
1. Mega Strangle Study (May 12th, 2014)
It's hard to believe it’s been 10 months since this gem went live! When this segment aired, this was the biggest strangle study that tastylive had ever conducted!
The Mega Strangle Study looked at over 300 different strangle trades, over the course of a 5-year period.
In this test, we only used Exchange Traded Funds (ETFs) so that we would avoid earnings announcements and other large binary events (which could throw the studies off). The ETFs that were used were:
- S&P 500 ($SPY)
- Gold ($GLD)
- Mexico ($EWW)
- 20+ Year Treasury Bonds ($TLT)
- Russell 2000 ($IWM)
As described earlier, we used 1 standard deviation strangles. For each simulation, we held the experiment constant by selling the strangle on the first trading day of each month, with 45 days to expiration (DTE).
We looked at what happened if the strangle was managed at 50% of its maximum profit, versus holding the strangle to expiration. We also segmented the results by implied volatility rank (IVR) to see what other useful information we could dig up (this means splitting the trades up by low/high IVR - IVR ≥ 50 = “high IV” and IVR ≤ 50 = “low IV”).
The results of this study show strong support for both managing winners and selling premium in high IV. For more details, check out the study and download the slides!
2. Selling Premium Works (October 23rd, 2014)
"Why choose to limit the profitability of a trade by selling premium?" This was the question we sought to answer with our second favorite strangle study! We wanted to demonstrate that selling premium is a better strategy than buying premium when it comes to strangles.
In the previous market measures study (the Mega Strangle Study), we looked at 5 underlyings with over 300 occurrences (so about 60 trades per underlying). In this Market Measures study, we narrow down the scope of the experiment to look exclusively at the S&P 500 ETF ($SPY), but ramp up the scale of the study, by placing 262 trades in the same underlying.
The one variable that we changed in this study was the date that we placed the strangles. Rather than selling one strangles on the first trading day of each month, we simulated placing the strangles every 5 days.
Over the course of the study, selling 262 strangles in $SPY generated a profit of $20,333 (meaning that inversely, buying the same strangles would have resulted in a loss of $20,333).
The study also showed us that despite having probability of profit of around 70% at trade entry, the actually number of winning strangles was 83% (a testament to implied volatility overstating future moves).
Check out the segment to get all the juicy details of these strangles, not to mention the fantastic graphics that make the results even easier to comprehend.
3. Premium: Losses before Profits (December 18th, 2014)
If you sell a decent amount of strangles, you have realized that after selling a strangle, more often than not, the trade will will show losses before it starts to show profits. This tends to make some investors weary after placing the trade and in some cases, can cause investors to exit a trade prematurely to avoid additional losses.
In this segment, we wanted to demonstrate to our viewers that seeing losses initially after selling a strangle is a normal occurrence by showing how frequently this actually happens. The takeaway is clear and simple...when selling premium, you may show a loss before you show a profit.
We set up the study by selling three different strangle configurations. We sold a strangle at 15 delta, 25 delta, and 45 delta, then compared the results.
As expected all three trades have a better realized number of wins than would be indicated by initial probabilities of profit (POP). We found on the 1 standard deviation strangles (which in this study were at the 15 delta), that 79% of all the trades experienced losses before expiration, with 83% of the trades being winners at expiration.
Check out the full segment to see the full details and tabular breakdowns!
Conclusion
There you have it...3 of our top strangle segments in all of their glory!
In order to keep pushing the industry forward for the retail investor, we plan to keep dishing out more awesome studies to help you perfect your strangle mechanics.
If you want to improve your strangle mechanics and see more of the studies we have done on strangles, you can find additional resources here.
Do you have a strangle study that you would like to see? Email the research team at research@tastylive.com!
Options involve risk and are not suitable for all investors. Please read Characteristics and Risks of Standardized Options before deciding to invest in options.