S&P 500 Backs Away from All-Time High After Producer Price Index report

S&P 500 Backs Away from All-Time High After Producer Price Index report
Also, 10-year T-note, gold, crude oil and euro Futures
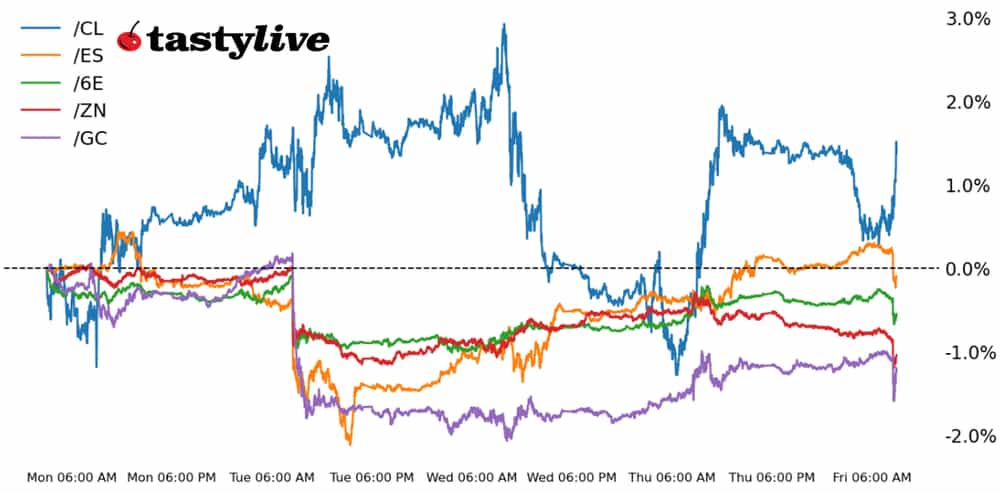
- S&P 500 E-mini futures (/ES): -0.18%
- 10-year T-Notes futures (/ZN): -0.57%
- Gold futures (/GC): -0.24%
- Crude oil futures (/CL): -0.35%
- Euro futures (/6E): -0.25%
Another “scary” inflation report this morning has produced a knee-jerk reaction like the one on Tuesday (although to a much lesser degree). The January U.S. producer price index (PPI) came in hotter than expected, although such an outcome was effectively preordained when the January U.S. consumer price index (CPI) and import/export price index beat expectations because of seasonal shifts and re-weightings. U.S. equities are taking a step backward, while bond yields are higher across the curve.
Symbol: Equities | Daily Change |
/ESH4 | -0.18% |
/NQH4 | +0.09 |
/RTYH4 | -1.39% |
/YMH4 | -0.36% |
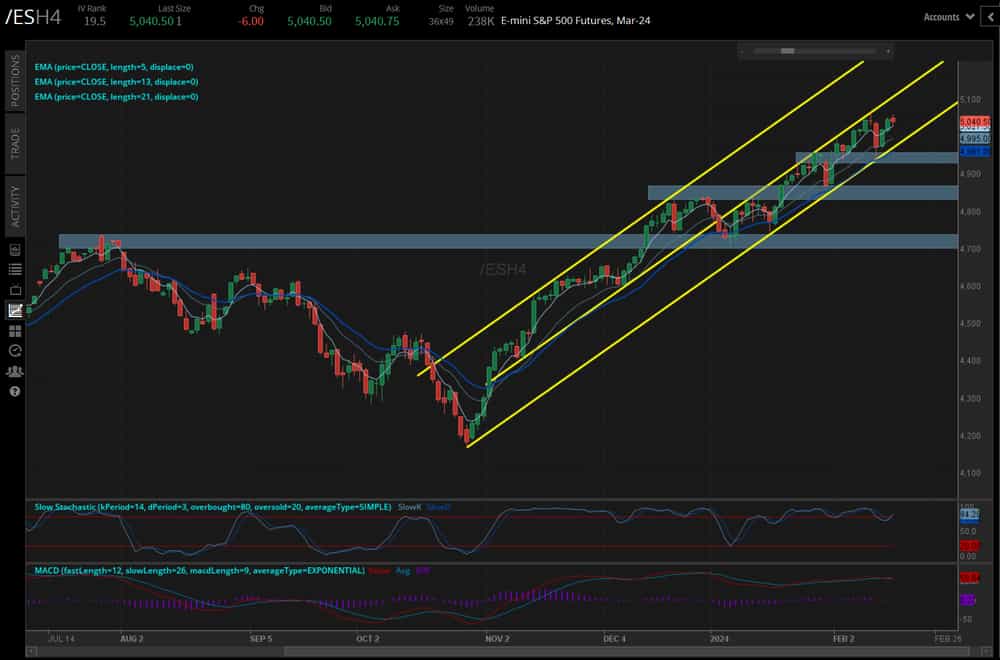
Stocks are lower today but are looking to close out what would be a record gains in fifteen of the past sixteen weeks, the longest bull run on record. The S&P 500 (/ESH4) is barely lower in the wake of the data, while the more rates-sensitive Russell 2000 (/RTYH4) is leading the way to the downside. Note that $2.4 trillion of options are expiring today.
Strategy: (41DTE, ATM) | Strikes | POP | Max Profit | Max Loss |
Iron Condor | Long 5000 p Short 5025 p Short 5175 c Long 5200 c | 27% | +775 | -475 |
Short Strangle | Short 5025 p Short 5175 c | 50% | +4937.50 | x |
Short Put Vertical | Long 5000 p Short 5025 p | 58% | +332.50 | -917.50 |
Symbol: Bonds | Daily Change |
/ZTH4 | -0.23% |
/ZFH4 | -0.47% |
/ZNH4 | -0.57% |
/ZBH4 | -0.79% |
/UBH4 | -0.85% |
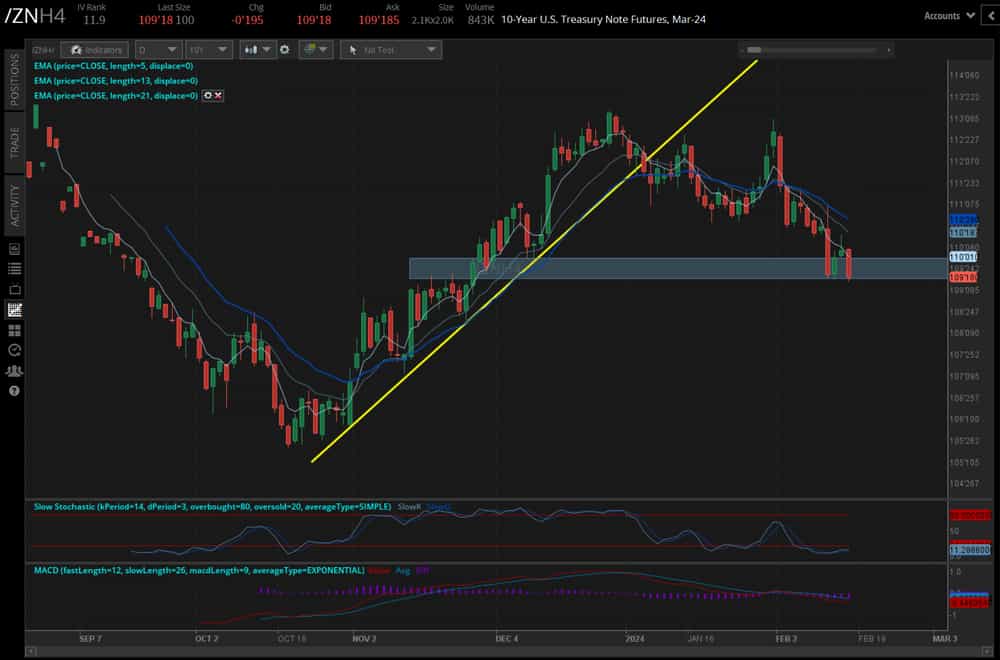
Bonds are back to their lows of the week as rates markets push back the timing of the first Federal Reserve interest rate cut even more than they had in recent days. Odds of a May cut have dropped to 31.6% today from 38.4% yesterday, following the release of the January U.S. PPI; over the past week, odds of a May cut have dropped from 60.7%. The long-end, where inflation expectations are embedded, is leading the way to the downside.
Strategy (35DTE, ATM) | Strikes | POP | Max Profit | Max Loss |
Iron Condor | Long 108 p Short 108.5 p Short 111.5 c Long 112 c | 49% | +234.38 | -265.63 |
Short Strangle | Short 108.5 p Short 111.5 c | 63% | +828.13 | x |
Short Put Vertical | Long 108 p Short 108.5 p | 75% | +109.38 | -390.63 |
Symbol: Metals | Daily Change |
/GCJ4 | -0.24% |
/SIH4 | +0.15% |
/HGH4 | +1.64% |
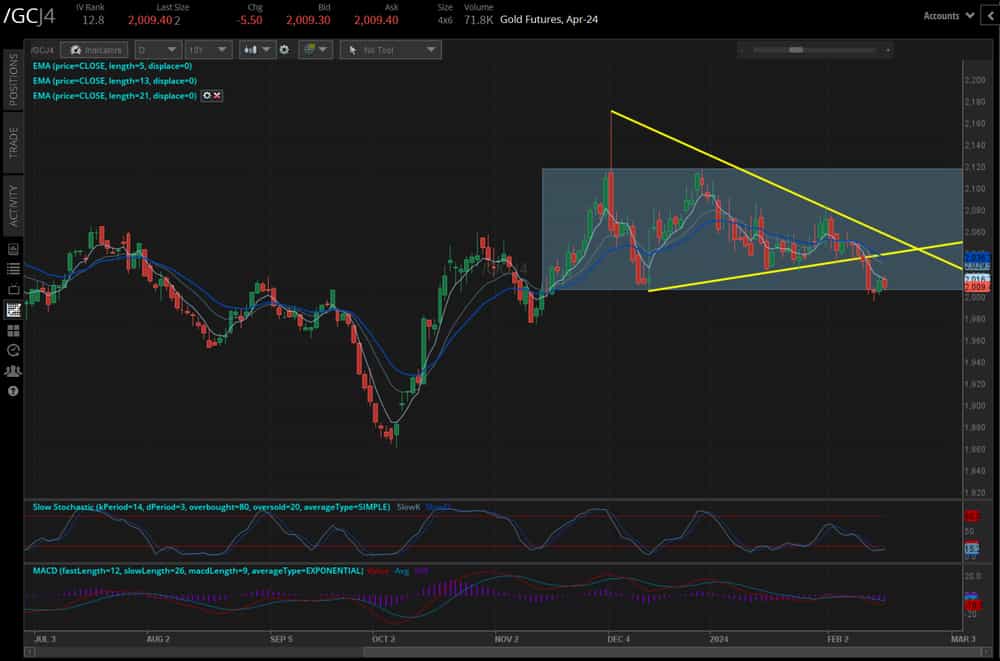
Gold (/GCJ4) and silver prices (/SIH4) have both been knocked back this morning, although the uptick in inflationary pressures is helping to keep copper prices (/HGH4) pointing higher. Yet /GCJ4 find itself hovering near support, while /SIH4 is still maintaining its elevation in breakout territory. Read yesterday’s precious metals technical outlook for more information.
Strategy (45DTE, ATM) | Strikes | POP | Max Profit | Max Loss |
Iron Condor | Long 1990 p Short 2000 p Short 2050 c Long 2060 c | 32% | +650 | -350 |
Short Strangle | Short 2000 p Short 2050 c | 58% | +3650 | x |
Short Put Vertical | Long 1990 p Short 2000 p | 63% | +320 | -680 |
Symbol: Energy | Daily Change |
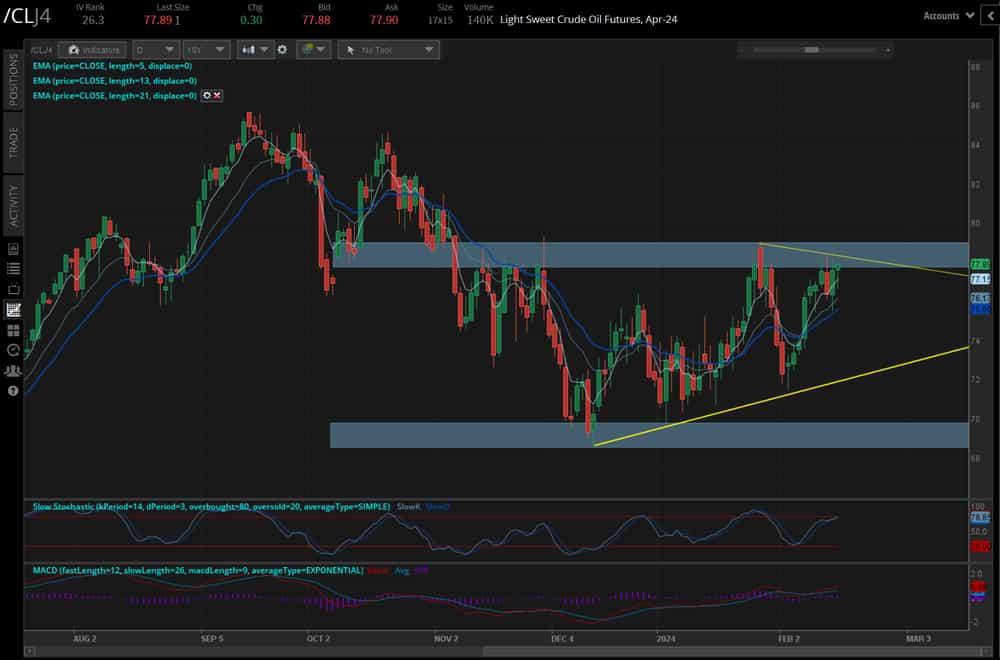
/CLJ4 | -0.35% |
/HOH4 | -1.87% |
/NGH4 | +1.08% |
/RBH4 | -1.13% |
Energy markets have been berated by weak data over the past few days, from signs that supply gluts are increasing to implied demand dropping more than anticipated. While this has been a consistent problem for natural gas prices (/NGH4), crude oil (/CLJ4) has displayed increasing resiliency as it hovers near multi-month range highs. The fight around 78-80 over the coming sessions could be the determining factor for the next directional move in /CLJ4.
Strategy (38DTE, ATM) | Strikes | POP | Max Profit | Max Loss |
Iron Condor | Long 72 p Short 73 p Short 80 c Short 81 c | 44% | +540 | -460 |
Short Strangle | Short 73 p Short 80 c | 61% | +2460 | x |
Short Put Vertical | Long 72 p Short 73 p | 78% | +200 | -800 |
Symbol: FX | Daily Change |
/6AH4 | -0.29% |
/6BH4 | -0.25% |
/6CH4 | -0.22% |
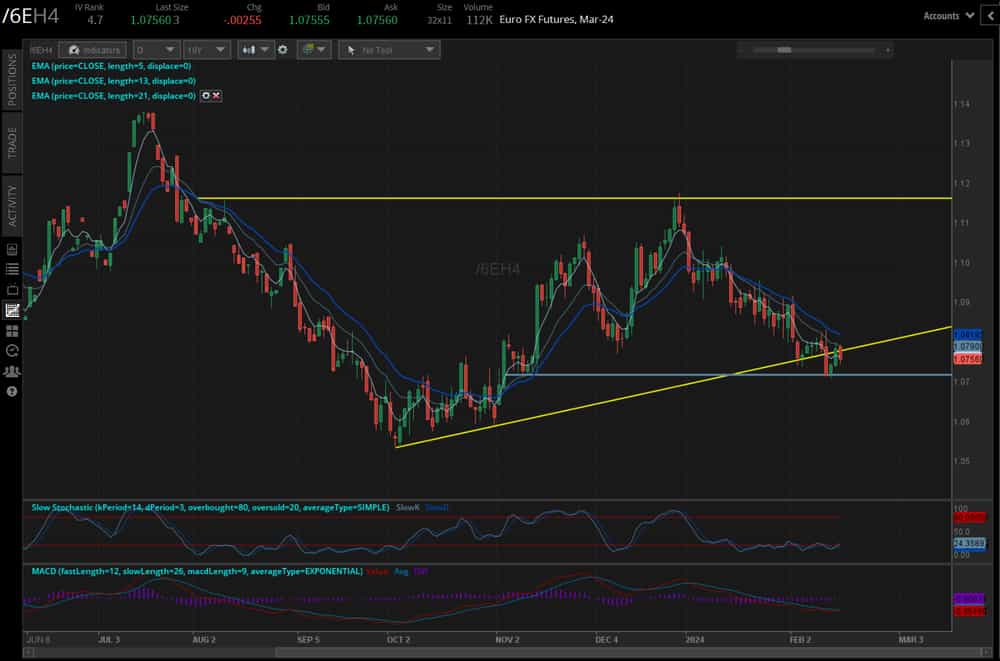
/6EH4 | -0.25% |
/6JH4 | -0.41% |
The U.S. dollar is up across the board as it becomes increasingly clear that the world will “out dove” the Federal Reserve in the coming months: Growth is strong in the U.S., which is not the case in Europe (the U.K is officially in recession) and Asia (as is Japan). The largest component of the DXY Index, the euro (/6EH4), is struggling to retake the uptrend from the October and November 2023 swing lows. Failure below 1.07 could open the doors for a swift drop into the 1.0500 area, where the 2023 lows were carved out.
Strategy (49DTE, ATM) | Strikes | POP | Max Profit | Max Loss |
Iron Condor | Long 1.06 p Short 1.07 p Short 1.09 c Long 1.110 c | 47% | +612.50 | -637.50 |
Short Strangle | Short 1.07 p Short 1.09 c | 59% | +1237.50 | x |
Short Put Vertical | Long 1.06 p Short 1.07 p | 76% | +300 | -950 |
Christopher Vecchio, CFA, tastylive’s head of futures and forex, has been trading for nearly 20 years. He has consulted with multinational firms on FX hedging and lectured at Duke Law School on FX derivatives. Vecchio searches for high-convexity opportunities at the crossroads of macroeconomics and global politics. He hosts Futures Power Hour Monday-Friday and Let Me Explain on Tuesdays, and co-hosts Overtime, Monday-Thursday. @cvecchiofx
For live daily programming, market news and commentary, visit tastylive or the YouTube channels tastylive (for options traders), and tastyliveTrending for stocks, futures, forex & macro.
Trade with a better broker, open a tastytrade account today. tastylive, Inc. and tastytrade, Inc. are separate but affiliated companies.
Options involve risk and are not suitable for all investors. Please read Characteristics and Risks of Standardized Options before deciding to invest in options.