IV Rank vs. IV Percentile | Skinny on Options Data Science

IV Rank vs. IV Percentile | Skinny on Options Data Science
Today on the blog we are "geeking out” about IV Rank and IV Percentile with Dr. Data.
Dr. Data is of course Dr. Mike Rechenthin - our resident expert on options data and modeling - who joined hosts Tom Sosnoff and Tony Battista for an episode of The Skinny on Options Data Science.
Those of you who have followed Dr. Data in the past will know that the "Skinny" series is dedicated to making the underlying math and data of options trading more accessible to the average trader.
The "Skinny" branch of programming on the tastylive financial network encompasses a range of shows that are easily accessible under the "Find Shows" link on the tastylive website.
We invite you to explore the series in greater depth if you are searching for more information on math, data, and modeling topics.
On this particular episode, Dr. Data helps viewers better understand the difference between Implied Volatility Rank (IVR) and Implied Volatility Percentile.
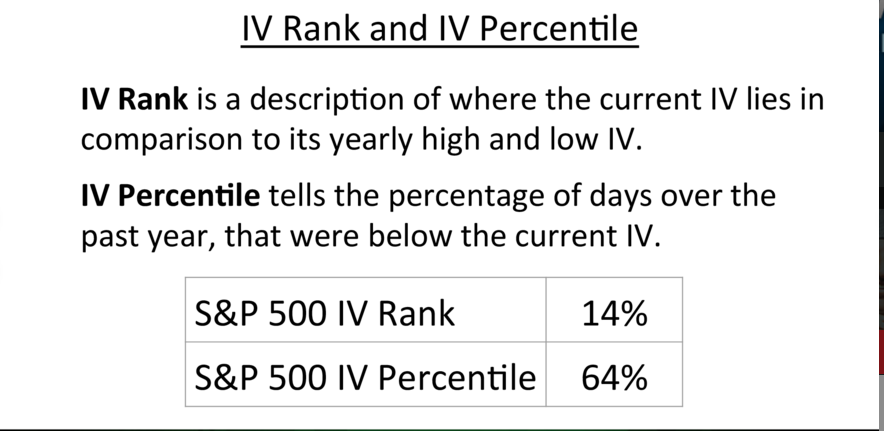
Implied Volatility Rank is a favored volatility measure at tastylive. IVR tells us whether implied volatility is high or low in a specific underlying based on the past year of implied volatility (aka “IV”) data.
For example, if XYZ has had an IV between 30 and 60 over the past year and IV is currently trading at 45, XYZ would have an IV rank of 50%. Since all underlyings have unique IV ranges, stating an arbitrary IV number does not help us decide how we should proceed with a strategy - that's where IVR comes into play.
Understanding where current implied volatility is trading compared to recent history can give a trader a better sense of whether the price of volatility is cheap or expensive given current conditions.
Implied Volatility Percentile (IVP), a totally different calculation, provides traders with another metric by which they can analyze the price of an option. IVP tells us the percentage of days over the last year that implied volatility traded below the current level.
For instance, if IVP is 90%, the understanding is that implied volatility traded below the current level for 90% of the past year’s data. This indicates that implied volatility at the current price is higher than usual.
On the other hand, if IVP is 10%, the understanding is that implied volatility has only traded below current levels 10% of the time over the past year. This second case might indicate that volatility is relatively cheap as compared to the last 12 months of data.
The slide below illustrates visually the differences between IVR and IVP:

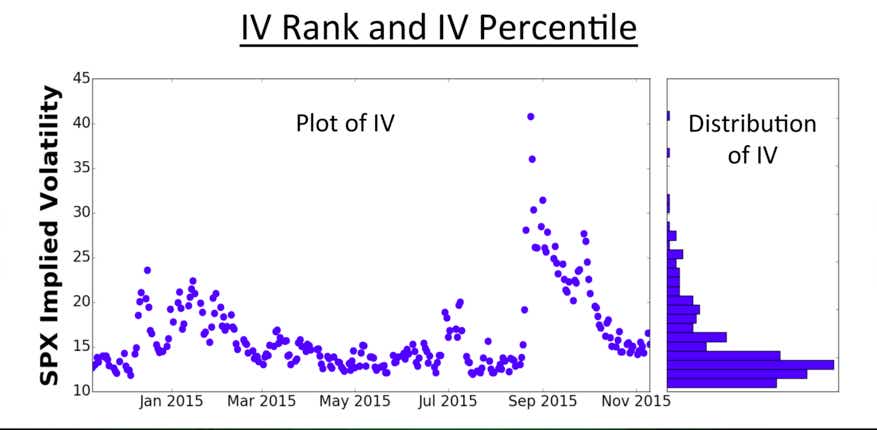
Another chart that helps conceptualize these concepts is a plot of SPX implied volatility over the last 12 months. Note the outlying data point that occurred in late summer/early fall as well as how the distribution of implied volatility (right side of graphic) is clustered under 20 for the SPX:

If you want to get a better understanding of the variables that go into the calculations of IVR and IVP, Dr. Data walks viewers through this process during the full episode of The Skinny on Options Data Science. We invite you to watch that at your convenience for a comprehensive look at this information.
Across the trading spectrum, market participants rely on different metrics to help them make trading decisions. Like any system or process, one key is to be consistent in your approach.
Those same principles hold true for utilizing Implied Volatility Rank (IVR) and Implied Volatility Percentile (IVP) in options trading. Both metrics can help a trader evaluate the price of an option relative to recent historical implied volatility in a particular underlying and option.
However, it’s important to be consistent in utilizing these metrics across a portfolio. For example, it wouldn’t make a lot of sense to sell an option based on a high IVR, while buying another one against it based on a low IVP.
Each and every trader finds success by following a unique path.
In the case of IVR vs. IVP it’s key to understanding the difference between the two measurements and then interpreting them in a consistent manner.
We hope you will take the time to review the entire episode on IVR and IVP when your schedule allows.
Please don’t hesitate to follow up with any questions or comments at support@tastylive.com or by leaving a comment below.
Sage Anderson has an extensive background trading equity derivatives and managing volatility-based portfolios. He has traded hundreds of thousands of contracts across the spectrum of industries in the single-stock universe.
Options involve risk and are not suitable for all investors. Please read Characteristics and Risks of Standardized Options before deciding to invest in options.