What Is A Yield Curve? | Beginners Guide To Yield Curves

Yield Curve Definition
A yield curve is a line plotted on a chart showing the yield of interest rates over the course of their maturity dates.
The x-axis represents the time until a bond matures and the y-axis represents the yield (interest rate) an investor would expect to receive for purchasing the bond.
Typically, the yield curve slopes upward because bonds with longer term maturity dates (10-year bonds or 30-year bonds
What Does A Yield Curve Tell Us?
The yield curve gives us a clue as to future interest rate change and economic activity.
Yield Curve Terminology?
If you’re new to interest rate futures, you may not be familiar with some of the terminology so rather than assume, we wanted to give you some definitions.
Yield
Another name for a bond’s interest rate (your expected return over the lifetime of the bond)
Maturity
The amount of time until a bond reaches its full potential value.
Understanding The Correlation Between Yields And Bond Prices
Types Of Yield Curves
Normal Yield Curve
A normal yield curve is where longer maturity bonds have a higher yield than shorter term maturity bonds. When the yield curve is normal, it generally means that the economy is growing and investors are confident.
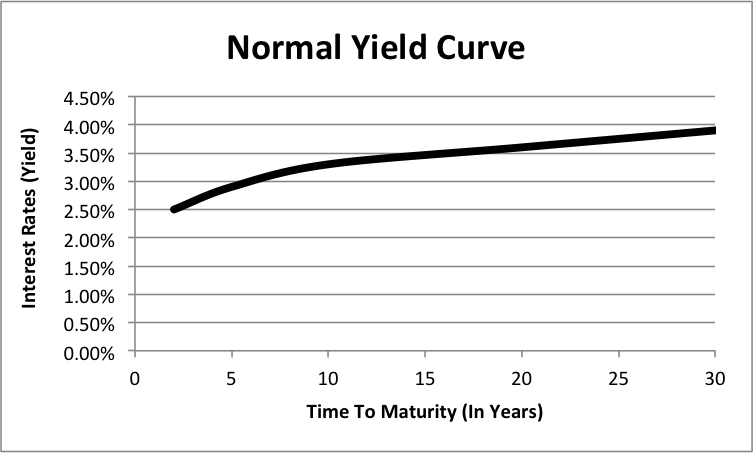
Normal Yield Curve
Inverted Yield Curve
An inverted yield curve is where longer maturity bonds have a lower yield than shorter term maturity bonds. When the yield curve is inverted, then it generally indicates a weakening economy.
Flat (Humped) Yield Curve
A flat yield curve is where longer term maturity bonds and shorter term maturity bonds are close to each other. When the yield curve is flat, then it generally indicates a slow down in the economy so investors are not being compensated for the risk of taking on longer term bonds.
For more examples of yield curves from our tastylive programming, go here and here!
And for more futures related topics, tune in to Futures Measures with Pete Mulmat!
Options involve risk and are not suitable for all investors. Please read Characteristics and Risks of Standardized Options before deciding to invest in options.