The S&P 500 and Nasdaq 100 are Looking for a Bottom

The S&P 500 and Nasdaq 100 are Looking for a Bottom
Nasdaq 100 down -5.41% month-to-date
- The brutal month of August rolls on for each of the four major U.S. indexes.
- Both /ESU3 and /RTYU3 have reached critical areas of support, formed over recent months.
- /NQU3 remains in a bit of a technical ‘no man’s land,’ with support still some ways away.
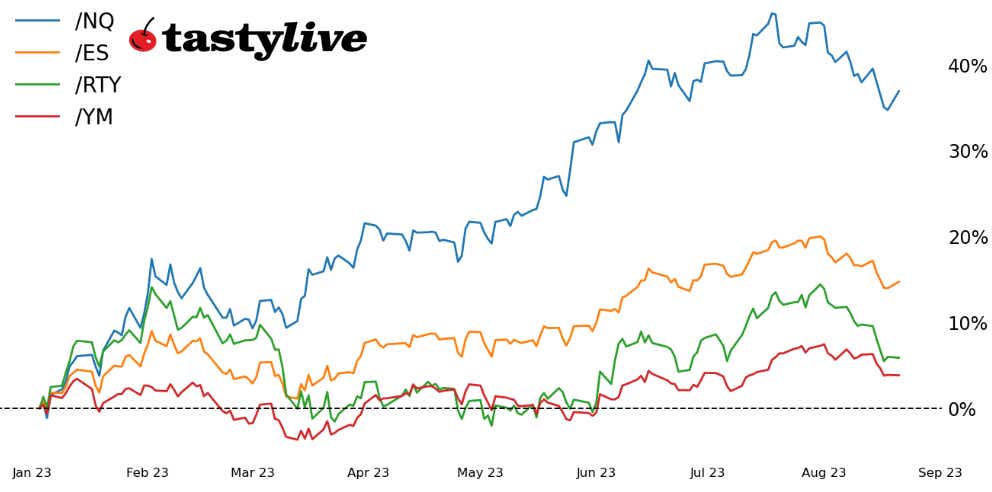
With less than 10 days to go until the books close on August, the situation has not improved by any stretch of the imagination for U.S. equity indexes. Each of the major indexes are down by at least -3%, led lower by the Russell 2000 (/RTYU3), which is off by -7.43% this month. The technical carnage remains, however, hope springs eternal.
Both the S&P 500 (/ESU3) and the Russell 2000 have reach meaningful technical support that has been carved out over the past several months, bringing about a crossroads of sorts: the bleeding stops here, and a base will form for a turn higher; or this is merely a pitstop before a swing to fresh multi-month lows.
/ES S&P 500 price technical analysis: daily chart (August 2022 to August 2023)
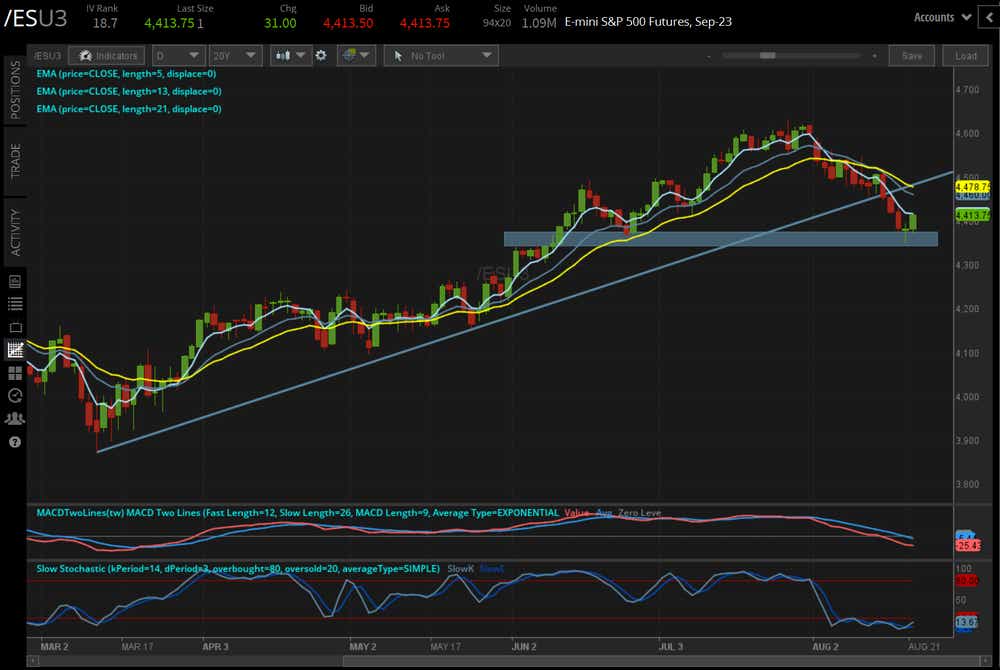
Last week, it was noted that “focus now shifts to the immediate downside around 4400 (rising trendline from the October 2022 and March 2023 lows) and the measured move at 4360 in the coming sessions.” Technical analysis is more art than science, as they say, and /ESU3 hit a low of 4350 last week.
Now, a morning candlestick pattern—a three-candlestick bottoming effort—may be forming in the area around the early-June swing highs and the late-June swing low, roughly 4335/65. Such a pattern would offer a technical reason to think a short-term low is forming.
Nevertheless, momentum remains bearish at best. /ESU3 is still below its daily 5-, 13-, and 21-EMA envelope, which is in bearish sequential order. MACD continues to decline while below its signal line. Slow stochastics remain in oversold territory; however, they may be trying to exit soon, which would confirm a short-term low has formed.
/NQ Nasdaq 100 price technical analysis: daily chart (August 2022 to August 2023)
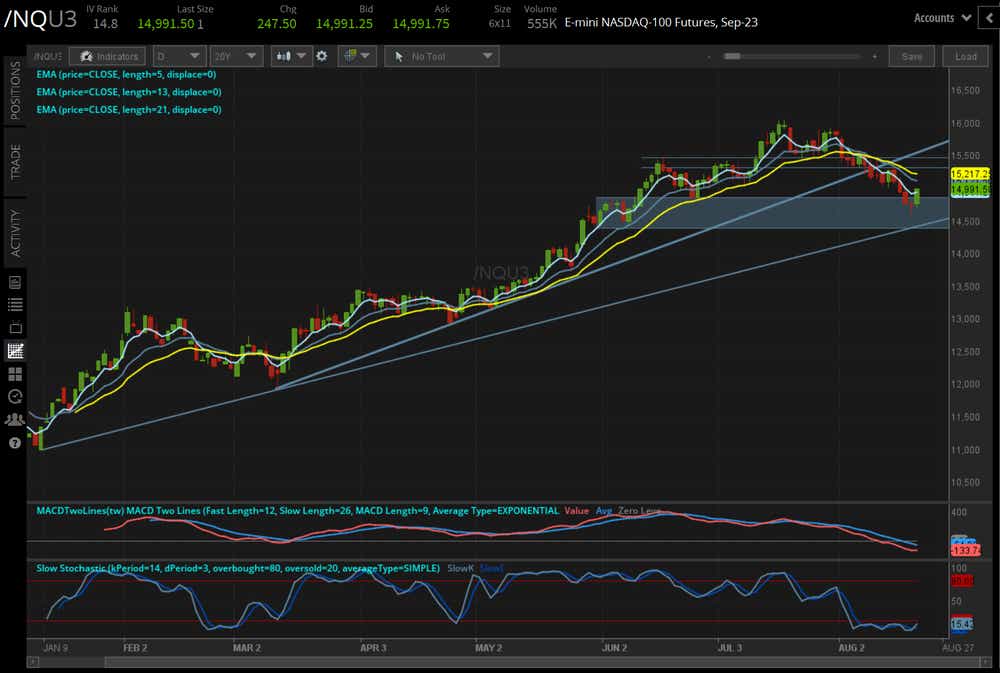
/NQU3 may be forming a short-term low as well near its late-June swing low (which was overshot), as it is working on its own morning candlestick pattern. The tech-heavy index fell back into a consolidation zone formed in early-June, not reaching the rising trendline from the January and March lows in the process.
Rising rates remain problematic, so the trendline may be reached. The momentum profile is likewise still bearish. /NQU3 is below its daily EMA envelope, which is in bearish sequential order. Like in /ESU3, MACD continues to decline while below its signal line, and similarly, the slow stochastics remain in oversold territory.
/RTY Russell 2000 price technical analysis: daily chart (August 2022 to August 2023)
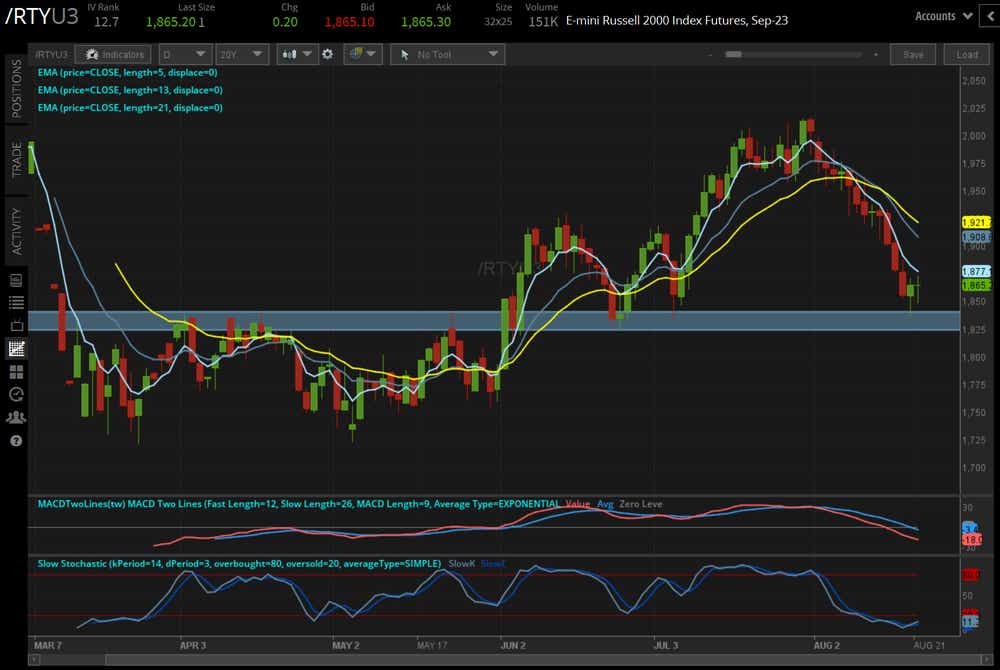
In the prior technical outlook, it was observed that “support doesn’t come into play until 1825/35, the swing highs from April and May as well as the late-June and early-July swing lows.” /RTYU3 hit a low of 1837.6 on Friday before briefly turning higher today.
This appears to be a U.S. Treasury yield story, given that /RTYU3 and /ZBU3 have one-week and one-month rolling correlations of +0.84. While support has come into play, another kick higher by long-end U.S. Treasury yields could weigh further on the Russell 2000; and if /RTYU3 breaks its multi-month support/resistance zone, then it likely means that the bottoming efforts in /ESU3 and /NQU3 will have failed as well.
Christopher Vecchio, CFA, tastylive’s head of futures and forex, has been trading for nearly 20 years. He has consulted with multinational firms on FX hedging and lectured at Duke Law School on FX derivatives. Vecchio searches for high-convexity opportunities at the crossroads of macroeconomics and global politics. He hosts Futures Power Hour Monday-Friday and Let Me Explain on Tuesdays, and co-hosts Overtime, Monday-Thursday. @cvecchiofx
For live daily programming, market news and commentary, visit tastylive or the YouTube channels tastylive (for options traders), and tastyliveTrending for stocks, futures, forex & macro.
Trade with a better broker, open a tastytrade account today. tastylive, Inc. and tastytrade, Inc. are separate but affiliated companies.
Options involve risk and are not suitable for all investors. Please read Characteristics and Risks of Standardized Options before deciding to invest in options.