Technical Analysis 101: Moving Averages

Technical Analysis 101: Moving Averages
A moving average is a tool that technical analysts use to show the average closing price of the market over a certain time span
- Moving averages can help traders to find the general trend of the market.
- A moving average can act as a resistance level when the price is below the moving average and as a support level when the price is above it.
- Some traders use more than one moving average on the same chart.
A moving average is a tool that technical analysts use to show the average closing price of the market over a certain time span. It helps traders to see the current market momentum more clearly by smoothing out the price fluctuations.
There are two main types of moving averages: simple moving average (SMA) and exponential moving average (EMA). The SMA calculates the average of the prices in the data set equally, while the EMA gives more weight to the recent prices.
The moving average can help traders to find the general trend of the market in a straightforward way. It can also be adjusted to different time periods according to the trader’s goals. Moving averages can be used to enter the market and to identify potential support and resistance levels. The moving average can act as a resistance level when the price is below the moving average (MA) and as a support level when the price is above the MA.
How to use moving averages
The moving average is a tool that shows the average closing price of the market over a certain time span. It helps traders to see the trend and the momentum of the market more clearly.
There are two main types of moving averages: simple moving average (SMA) and exponential moving average (EMA). The SMA is the average of the prices in the data set, while the EMA gives more importance to the recent prices.
Traders use moving averages in three ways:
- To find the trend direction.
- To find support and resistance levels.
- To use multiple moving averages for different time periods.
Identifying the trend
The moving average shows the direction of the trend by moving up or down with the prices. When the prices are going up, the moving average also goes up, which means the market is bullish. Traders may look for buying opportunities in this case.
When the prices are going down, the moving average also goes down, which means the market is bearish. Traders may look for selling opportunities in this case.
Identifying support and resistance
The moving average can also act as a support or a resistance level for the prices. When the prices are above the moving average, the moving average can act as a support level, where the prices may bounce back up. Traders may use the moving average as an entry point or a stop loss level in this case.
When the prices are below the moving average, the moving average can act as a resistance level, where the prices may bounce back down. Traders may use the moving average as an exit point or a stop loss level in this case.
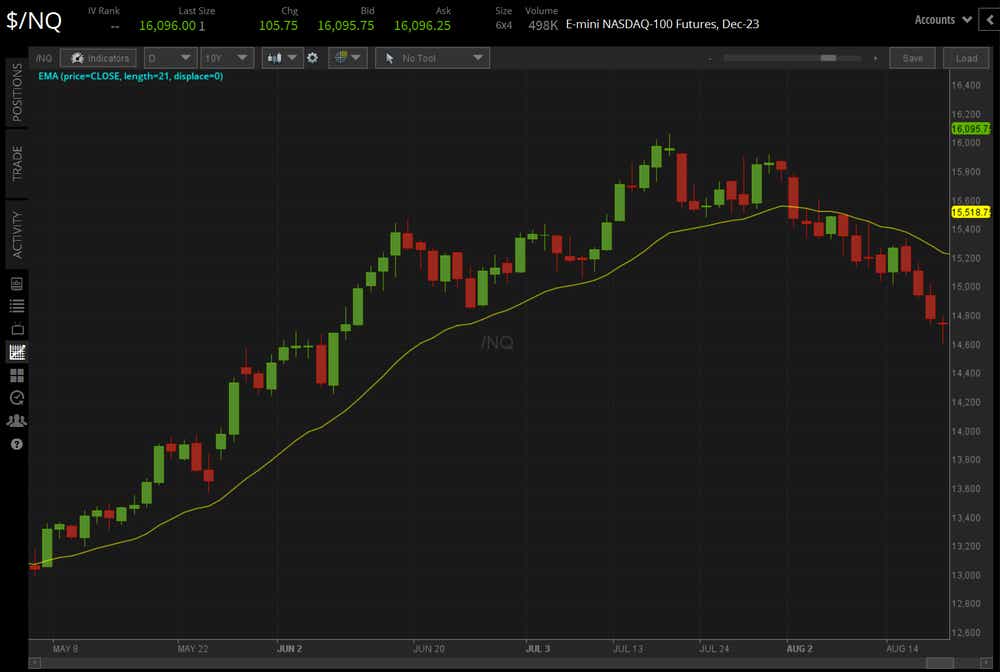
The chart below shows how the moving average can be used as a support and a resistance level, using the daily 21-EMA (one-month moving average, yellow line) in the Nasdaq 100 (/NQ) in mid-2023:
Overlaying moving averages
Some traders use more than one moving average on the same chart, as shown in the chart below, using the daily 5-day EMA (one-week moving average, blue line) and daily 21-day EMA (one-month moving average, yellow line) in the Treasury bond (/ZB) in the second half of 2023:

This allows them to see the short-term and the long-term trends of the market. When the prices cross above or below the moving averages, it can show the strength or the weakness of the market. This is similar to using the moving average convergence/divergence (MACD) oscillator.
Another way to use multiple moving averages is to look for the cross-over of the moving averages. When the 50-SMA crosses above the 200-SMA, this is called the golden cross, generally considered to be a bullish sign. When the 50-SMA crosses below the 200-SMA, this is called the death cross, which is considered a bearish sign. Traders may use these crossovers as signals to open or close their trades.
Christopher Vecchio, CFA, tastylive’s head of futures and forex, has been trading for nearly 20 years. He has consulted with multinational firms on FX hedging and lectured at Duke Law School on FX derivatives. Vecchio searches for high-convexity opportunities at the crossroads of macroeconomics and global politics. He hosts Futures Power Hour Monday-Friday and Let Me Explain on Tuesdays, and co-hosts Overtime, Monday-Thursday. @cvecchiofx
For live daily programming, market news and commentary, visit tastylive or the YouTube channels tastylive (for options traders), and tastyliveTrending for stocks, futures, forex & macro.
Trade with a better broker, open a tastytrade account today. tastylive, Inc. and tastytrade, Inc. are separate but affiliated companies.
Options involve risk and are not suitable for all investors. Please read Characteristics and Risks of Standardized Options before deciding to invest in options.