Tariff Truce Triggers Historic S&P 500 Surge: History Says More Gains Ahead

Tariff Truce Triggers Historic S&P 500 Surge: History Says More Gains Ahead
That makes sense because bullish catalysts usually cause the market’s major upswings
- The market exploded higher after President Trump announced a pause on tariffs.
- The S&P 500 was on track to record one of its best daily gains on record.
- Historical returns analysis indicates more gains are on the way.
The tariffs are officially paused, and the market rallied with spectacular enthusiasm. The S&P 500 rose 8.85% with 30 minutes left in the trading day today, April 9, after President Trump announced tariffs would be paused. It’s a quick reversal from the Liberation Day strategy announced last week, which sent markets sharply lower.
Bulls rushed into the market after the administration revealed all tariffs would be paused. A 10% tariff rate will remain on virtually all U.S. trading partners through the period, except for China with a rate of about 125%, according to the White House. Advisors to the president argued this was the strategy all along. If it was or it wasn’t doesn’t matter much for traders because the signal was clear—buy.
What history says happens after large daily gains
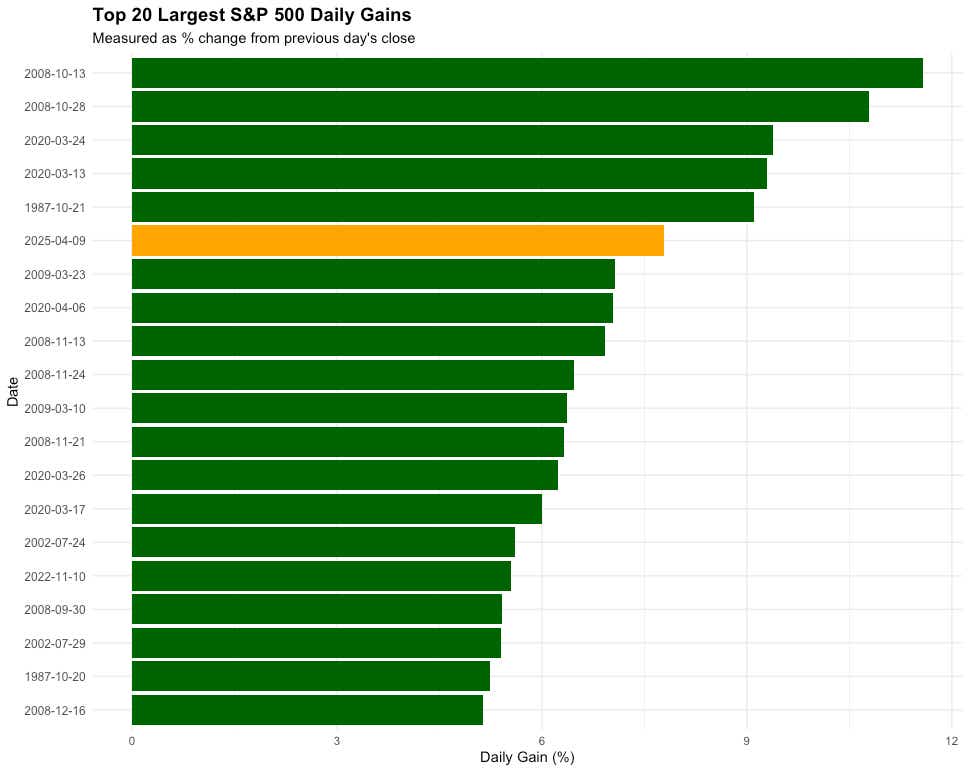
Assuming the gain holds, the S&P 500 is on track for its sixth largest daily gain on a percentage basis. The chart below highlights the historical context, showing the 20 largest S&P 500 gains as a percent from the previous day’s close. The record holder remains Oct. 13, 2008, when a globally coordinated effort by central banks and other institutions provided reassurances to investors that the global economy wouldn’t be destroyed.
Just a few weeks after that, the Federal Reserve cut interest rates by more than expected, causing the market to rally with astonishing effect again, marking the second largest daily gain. Another top contender came in the days following “Black Monday” when the market crashed by more than 20% in a single day. Other large moves were during the COVID pandemic.
But what happened after these monster market moves, and can past events point to history repeating itself?
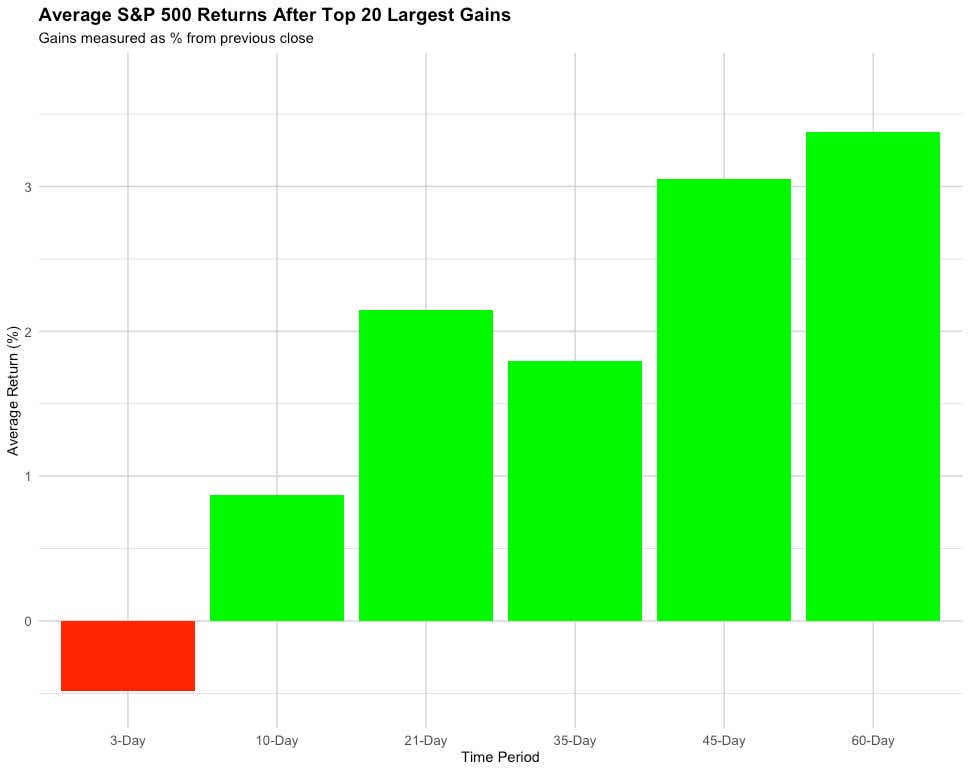
I looked at data going back to 1983 and measured the average S&P 500 returns after the top 20 largest gains. The chart below shows what has occurred.
The three-day return saw an average decline of 0.48% but a median return of 0.89%, while the follow-on periods saw positive average and median returns. A short-term pullback after such a monster up move isn’t unusual because profit takers come into the market to collect their gains.
The best bets for big returns
However, if we base a trade on these historical returns, we see the 45-day and 60-day windows offer the best bets for large gains. The average 45-day return is 3.05%, while the median return is 1.37%.
If we move out to 60 days, it’s even better. The average 60 day return was 3.37%, and the median return was 4.08%.
It isn’t too surprising. A huge up move in the market is usually caused by a bullish catalyst, like the ones we discussed above. In this case, the tariffs are paused—expect for China.
So, does it make sense to get long after today’s move? It does if history is our guide.
Thomas Westwater, a tastylive financial writer and analyst, has eight years of markets and trading experience. #@fxwestwater
For live daily programming, market news and commentary, visit tastylive or the YouTube channels tastylive (for options traders), and #tastyliveTrending for stocks, futures, forex & macro.
Trade with a better broker, open a tastytrade account today. tastylive Inc. and tastytrade Inc. are separate but affiliated companies.
Options involve risk and are not suitable for all investors. Please read Characteristics and Risks of Standardized Options before deciding to invest in options.