Stocks End the Week on Strong Technical Footing

Stocks End the Week on Strong Technical Footing
Here's what you should know going into next trading week on the heels of strong technical momentum, the Nasdaq pop and the Dow Futures Rally
- Month-to-date, all four major equity indexes are in positive territory.
- Technical momentum has improved in both /ES and /NQ, while /RTY achieved a key target level.
- The second half of July so far has been less bullish than the first half for stocks.
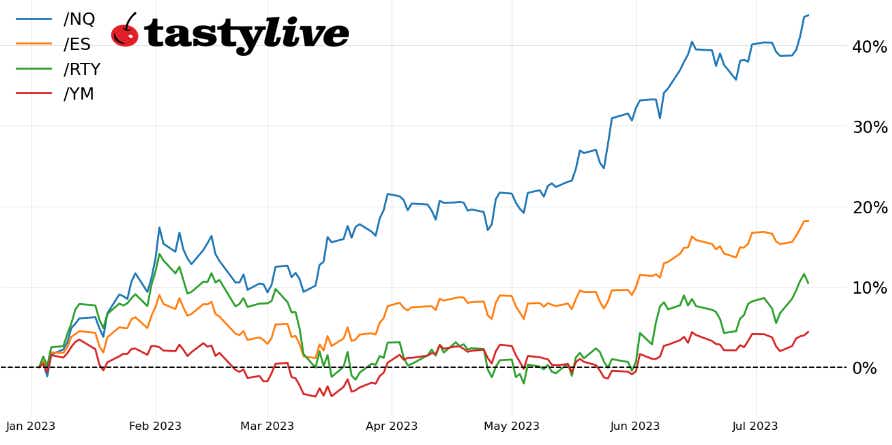
Market update: Nasdaq 100 up +2.62% month-to-date
U.S. equity markets have continued their strong start to the summer trading months, with each of the four major equity index futures, /ES, /NQ, /RTY and /YM, posting gains through the first two weeks of July. Historically, July has been one of if not the best months of the year for stocks, so the performance may not necessarily be a surprise to seasonality watchers. While seasonality trends cool off in the second half of the month, the technical postures of the four major equity indexes remain bullish; there’s little evidence to suggest that tops have been reached.
/ES S&P 500 price technical analysis: daily chart (July 2022 to July 2023)
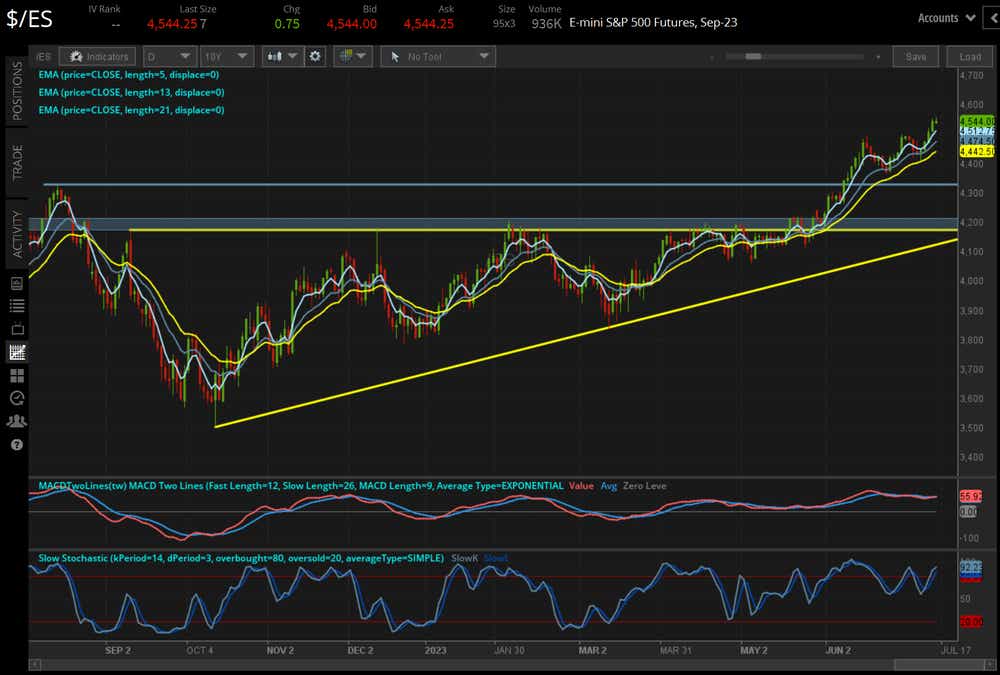
At the end of June, it was noted that “a return to the yearly high of 4493.75 could be achieved by early July.” In recent days, /ES broke above short-term ascending triangle resistance, carving out a fresh yearly high in the process. As has been the case since our prior equities technical update, /ES has not closed below its daily 21-EMA (one month moving average) since May 25. The moving average convergence/divergence (MACD) has issued a bullish crossover while above its signal line, and slow stochastics have reentered overbought territory. Considering measures of volatility are still depressed (/ESU3: IV Index – 13.1%; IVR – +1.3) and the technical structure remains bullish, further gains cannot be ruled out in the near-term.
/NQ Nasdaq 100 price technical analysis: daily chart (July 2022 to July 2023)
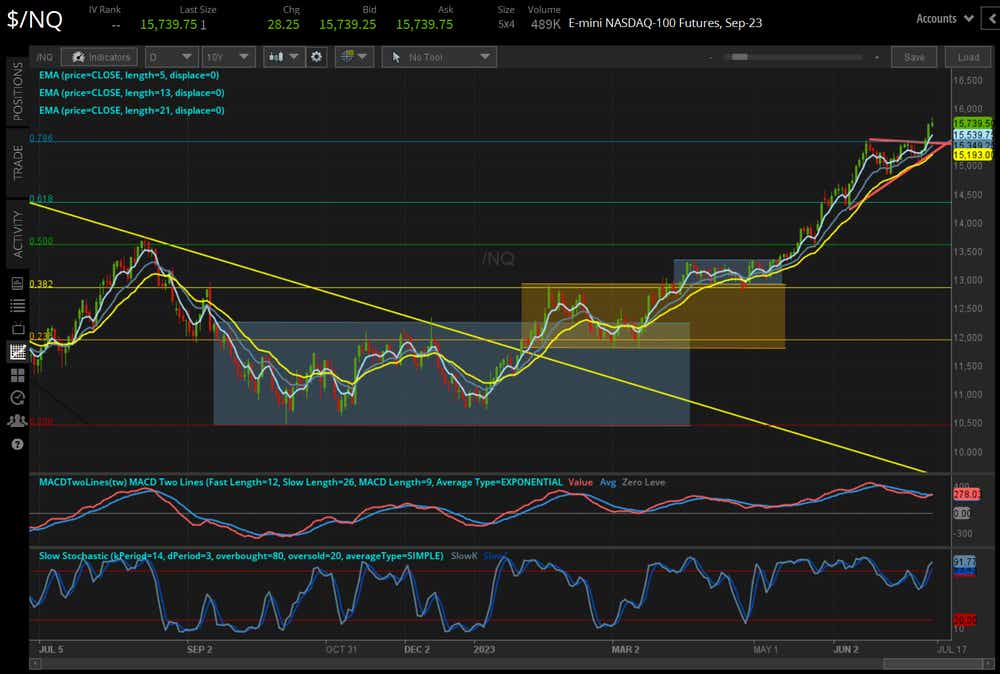
Like /ES, /NQ has traded to fresh yearly highs after breaking through symmetrical resistance this week. /NQ retains the most consistent bullish momentum profile among the major four indexes, having closed above its daily 21-EMA every session since May 5. Momentum indicators are increasingly bullish, with MACD issuing a buy signal above its signal line and slow stochastics returning to overbought territory. Now trading through the 78.6% Fibonacci retracement of the November 2021 high to October 2022 low range, there are few technical hurdles preventing further topside extension. It’s too soon to say it will happen, but the chart is increasingly shaping up like /NQ may make an attempt at its all-time high at some point over the next few months.
/RTY Russell 2000 price technical analysis: daily chart (July 2022 to July 2023)
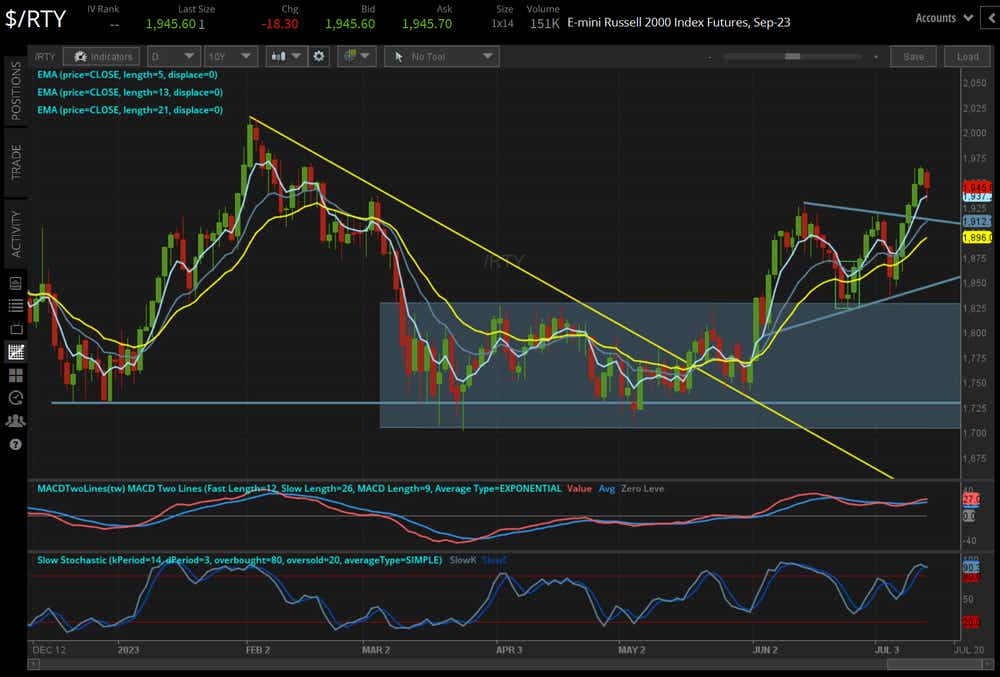
In our last update of /RTY, it was observed that “a morning star candlestick pattern (highlighted from June 23 to 27) is a bottoming pattern, and it developed against the post-SVB range highs near 1830…charts may be offering an important tell that, if the laggard of 2Q ’23 is able to find some footing, then the leaders may be able to resume their march higher yet.”
The late-June morning star candlestick pattern was part of a broader consolidation into a symmetrical triangle following the breakout of the initial post-SVB trading range (1700-1830). A continuation pattern, symmetrical triangle resistance was breached in recent days, achieving the measured move (the difference between the initial highs and lows of the triangle, 1930-1800 = 130 points, added to the final retest of triangle support, at 1830, yielded an upside target of 1960 on the breakout; /RTY peaked at 1967 before pulling back).
Until /RTY drops back into the symmetrical triangle (under 1910 over the coming week), any pullback should be eyed as mere profit-taking, as the broader technical structure retains its bias for an attempt to return to the yearly highs set in February.
Christopher Vecchio, CFA, tastylive’s head of futures and forex, has been trading for nearly 20 years. He has consulted with multi-national firms on FX hedging and lectured at Duke Law School on FX derivatives. Vecchio searches for high-convexity opportunities at the crossroads of macroeconomics and global politics. He hosts Futures Power Hour Monday-Friday and Let Me Explain on Tuesdays, and co-hosts Overtime, Monday-Thursday. @cvecchiofx
For live daily programming, market news and commentary, visit tastylive or the YouTube channels tastylive (for options traders), and tastyliveTrending for stocks, futures, forex & macro.
Trade with a better broker, open a tastytrade account today. tastylive, Inc. and tastytrade, Inc. are separate but affiliated companies.
Options involve risk and are not suitable for all investors. Please read Characteristics and Risks of Standardized Options before deciding to invest in options.