Stock Market Futures May 2023: Sell in May and Go Away?

Stock Market Futures May 2023: Sell in May and Go Away?
Stock Market Futures Breakdown: May 2023 Update
As a new month begins, it’s worth reviewing financial market seasonality to see if there are any discernible patterns. For May, our lookback windows cover the past 5-years and 10-years. As noted previously, while a 15-year study may also prove valid, beyond there (e.g. a 20-year study) would encompass a pre-central bank intervention world – an entirely different monetary regime that may not yield any insight into today.
Still, the smaller data sets have their own issues. For each of the instruments below, their 5-year average performances are all eclipsed by their respective standard deviation of returns (a function of the February to May 2020 window proving volatile around the onset of the COVID-19 pandemic). We soon may be exiting the window in which seasonality is little more than a talking point taken with a grain of salt.
Sell in May and Go Away?
The bigger question to answer, though, is “sell in May and go away?” An adage among traders, it’s often repeated ad nauseum among financial pundits. But the fact of the matter is that the phrase has no seasonal basis. In fact, as you’ll see below for /ES and /NQ, the middle of the year has produced some of the strongest returns in recent memory. “Sell in May and go away” is a nice rhyme, but nothing more.
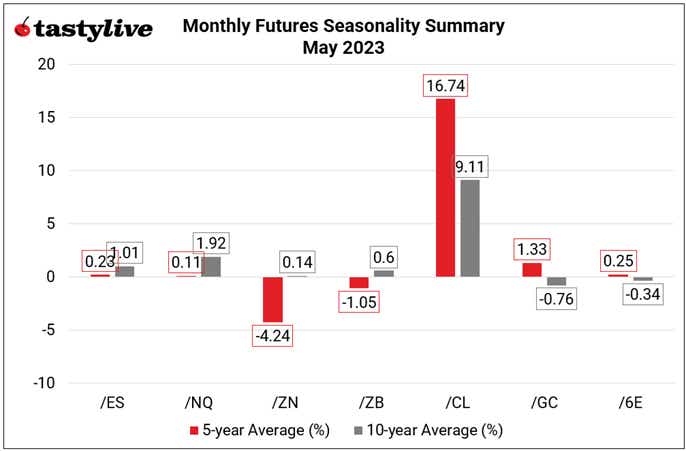
Monthly Futures Seasonality Summary – May 2023
S&P 500 (/ES) Futures Monthly Seasonality
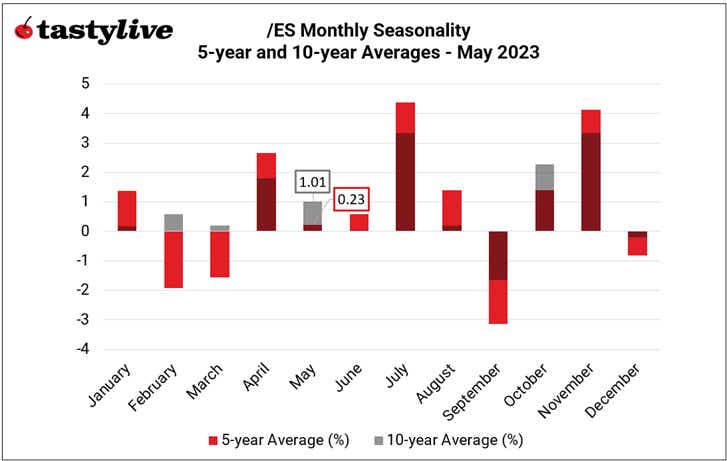
May is a slightly bullish month for /ES, on a seasonal basis. Over the past 5-years, it has been the fifth worst month of the year for the index, averaging a gain of +0.23% (σ = 4.26%). Over the past 10-years, it has been the fifth best month of the year, averaging a gain of +1.01%.
NASDAQ 100 (/NQ) Futures Monthly Seasonality
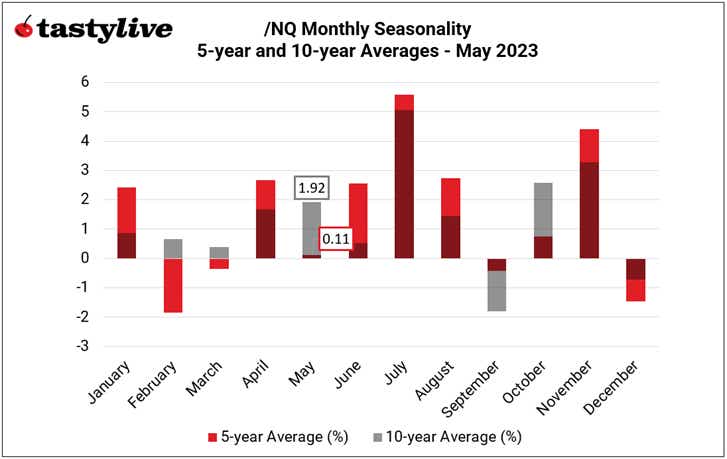
May is a bullish month for /NQ, on a seasonal basis. Over the past 5-years, it has been the fifth worst month of the year for the index, averaging a gain of +0.11% (σ = 6.07%). Over the past 10-years, it has been the fourth best month of the year, averaging a gain of +1.92%.
Treasury Notes (/ZN) Futures Monthly Seasonality
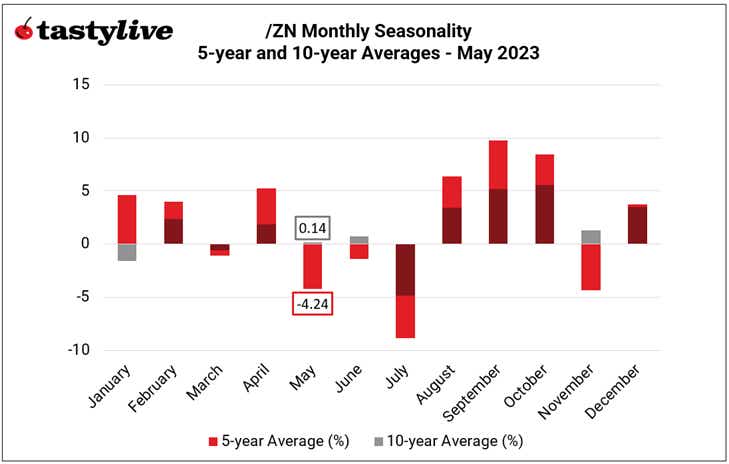
May is a bearish month for /ZN, on a seasonal basis. Over the past 5-years, it has been the third worst month of the year for the notes, averaging a loss of -4.24% (σ = 6.42%). Over the past 10-years, it has been the fourth worst month of the year, averaging a gain of +0.14%.
Treasury Bonds (/ZB) Futures Monthly Seasonality
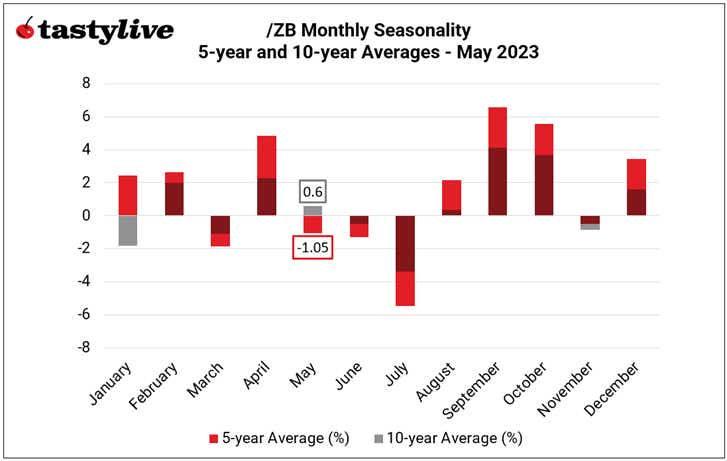
May is a mixed month for /ZB, on a seasonal basis. Over the past 5-years, it has been the fourth worst month of the year for the bonds, averaging a loss of -1.05% (σ = 7.81%). Over the past 10-years, it has been the sixth best month of the year, averaging a gain of +0.60%.
Crude Oil (/CL) Futures Monthly Seasonality
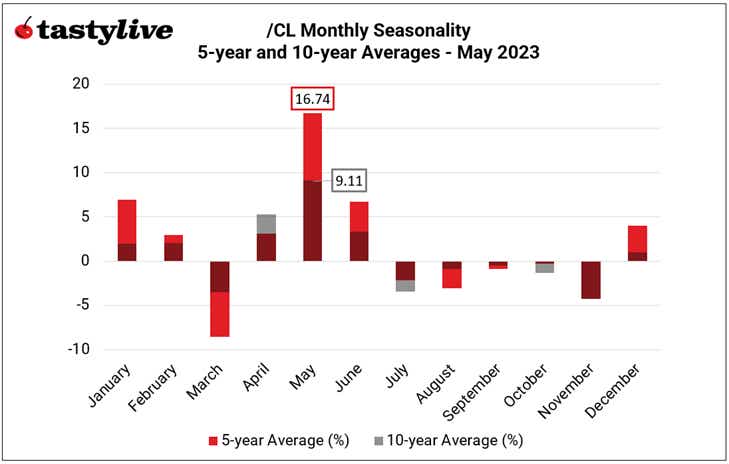
May is a bullish month for /CL, on a seasonal basis. Over the past 5-years, it has been the best month of the year for the energy product, averaging a gain of +16.74% (σ = 41.20%). Over the past 10-years, it has been the best month of the year, averaging a gain of +9.11%.
Gold (/GC) Futures Monthly Seasonality
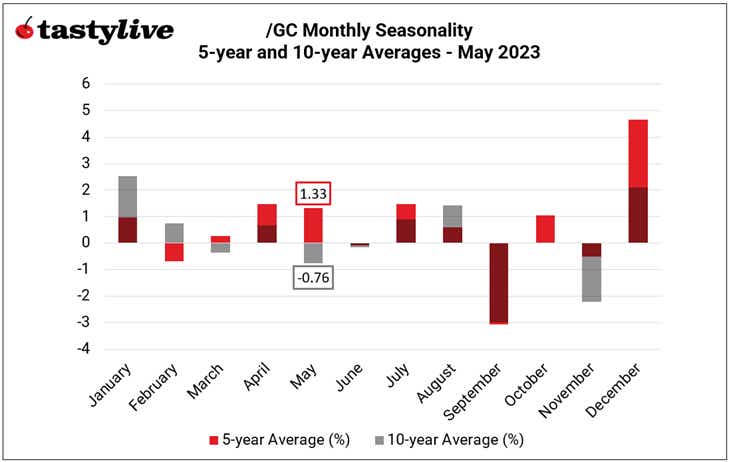
May is a mixed month for /GC, on a seasonal basis. Over the past 5-years, it has been the fourth best month of the year for the precious metal, averaging a gain of +1.33% (σ = 4.28%). Over the past 10-years, it has been the third worst month of the year, averaging a loss of -0.76%.
Euro (/6E) Futures Monthly Seasonality
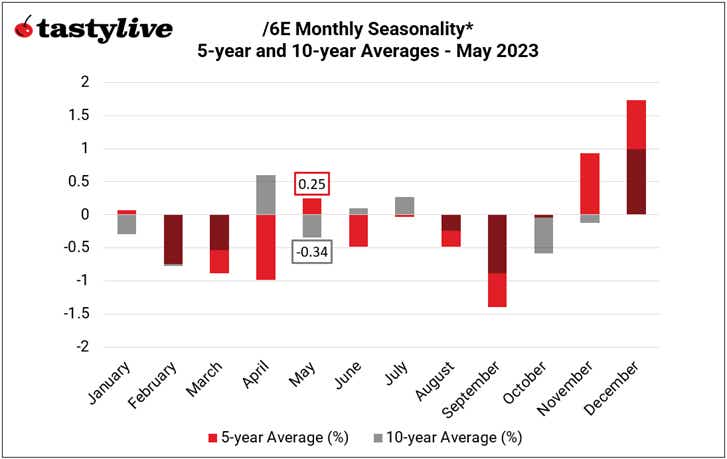
May is a mixed month for /6E, on a seasonal basis. Over the past 5-years, it has been the third best month of the year for the pair, averaging a gain of +0.25% (σ = 2.11%). Over the past 10-years, it has been the fifth worst month of the year, averaging a loss of -0.34%. Note: the time series for Euro futures does not extend beyond 2018; the data series has been backfilled using EUR/USD spot rates as a proxy.
--- Written by Christopher Vecchio, CFA, Head of Futures and Forex
Options involve risk and are not suitable for all investors. Please read Characteristics and Risks of Standardized Options before deciding to invest in options.