S&P 500 Takes Aim at 6000; Natural Gas Prices Plunge

S&P 500 Takes Aim at 6000; Natural Gas Prices Plunge
Also 10-year T-note, gold, crude oil, and Japanese yen futures
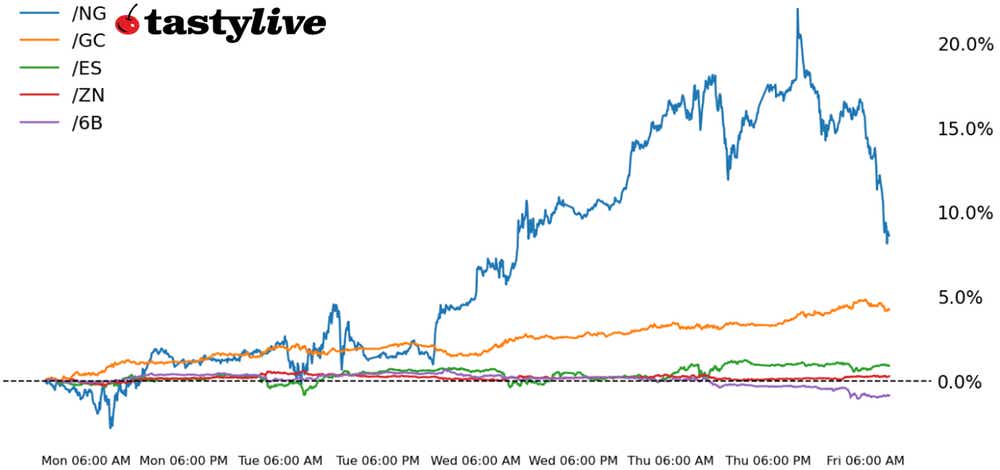
- S&P 500 E-mini futures (/ES): -0.12%
- 10-year T-note futures (/ZN): +0.16%
- Gold futures (/GC): +0.78%
- Natural gas futures (/NG): -4.52%
- British pound futures (/6B): -0.49%
The sun is setting on the trading week, and today’s price action is relatively benign (both in terms of price ranges and absolute change) in U.S. equity markets, where no major index is +/- 0.3% on the day. Bonds are perking up across the curve, thanks in part to deflating inflation expectations amid a sharp turnaround in energy prices. Natural gas, which was up by more than 22% week-to-date yesterday, is now up by just over 8% this week. Elsewhere, the U.S. dollar continues to gather pace vs. its European counterparts; EUR/USD (both in spot and in futures) is closer to parity than it is to its exchange rate at the start of November.
Symbol: Equities | Daily Change |
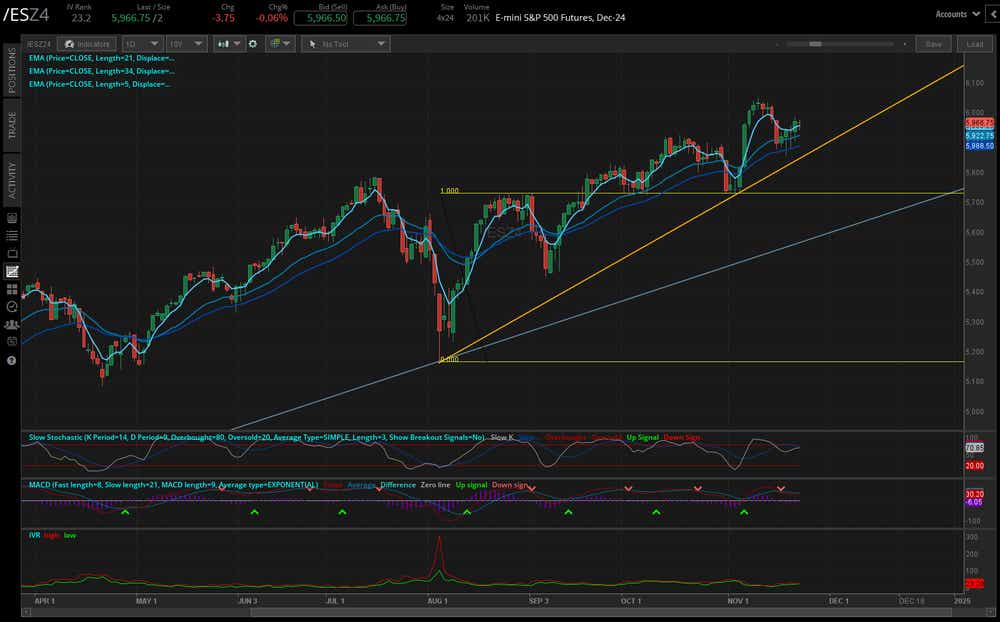
/ESZ4 | -0.12% |
/NQZ4 | -0.27% |
/RTYZ4 | +0.27% |
/YMZ4 | +0.03% |
U.S. stocks are relatively quiet on today, a bit of a hangover, if you will, after Nvidia (NVDA) and Snowflake (SNOW) earnings on Wednesday that helped spark a leg higher in software and semiconductor stocks. The Russell 2000 (/RTYZ4) is walking away from the week as the top performer, although the S&P 500 (/ESZ4) is on pace for its second-highest weekly close ever.
Strategy: (47DTE, ATM) | Strikes | POP | Max Profit | Max Loss |
Iron Condor | Long 5700 p Short 5750 p Short 6350 c Long 6400 c | 60% | +475.50 | -2042.50 |
Short Strangle | Short 5750 p Short 6350 c | 66% | +2512.50 | x |
Short Put Vertical | Long 5700 p Short 5750 p | 81% | +287.50 | -2212.50 |
Symbol: Bonds | Daily Change |
/ZTH5 | +0.02% |
/ZFH5 | +0.09% |
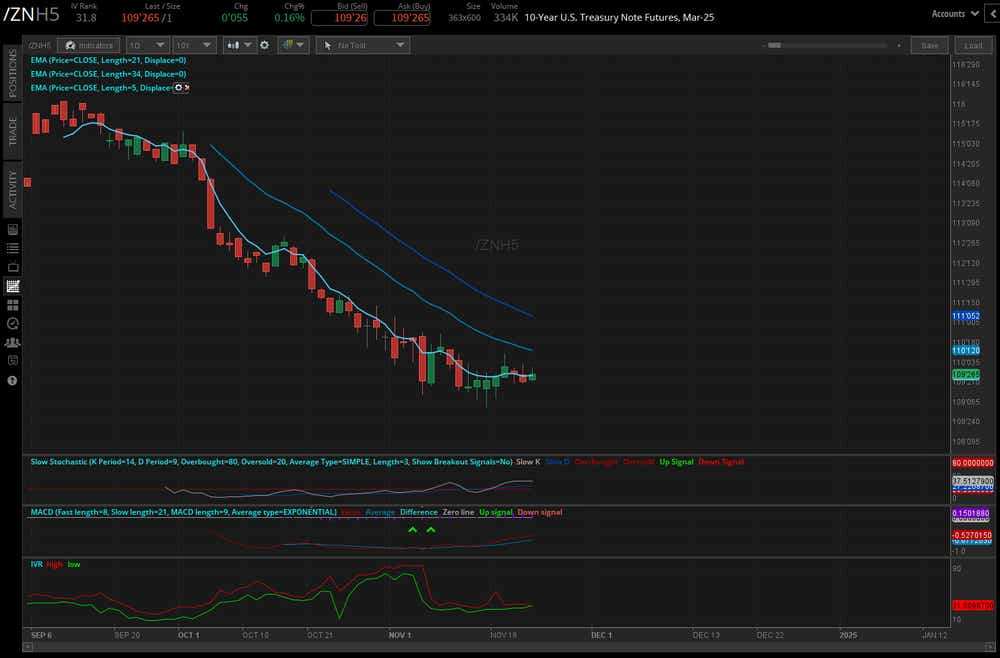
/ZNH5 | +0.16% |
/ZBH5 | +0.32% |
/UBH5 | +0.41% |
U.S. Treasuries have made little directional progress since the election, and in that context today’s gains across the curve mean very little. Neither 10-year notes (/ZNH5) nor 30-year bonds (/ZBH5) have closed above or below the trading range that was carved out on Nov. 6. Fed rate cut odds have edged higher, with traders discounting a 59.6% probability of a 25-basis-point (bps) rate cut in December.
Strategy (63DTE, ATM) | Strikes | POP | Max Profit | Max Loss |
Iron Condor | Long 106 p Short 107 p Short 113 c Long 114 c | 67% | +218.75 | -781.25 |
Short Strangle | Short 107 p Short 113 c | 72% | +515.63 | x |
Short Put Vertical | Long 106 p Short 107 p | 89% | +109.38 | -890.63 |
Symbol: Metals | Daily Change |
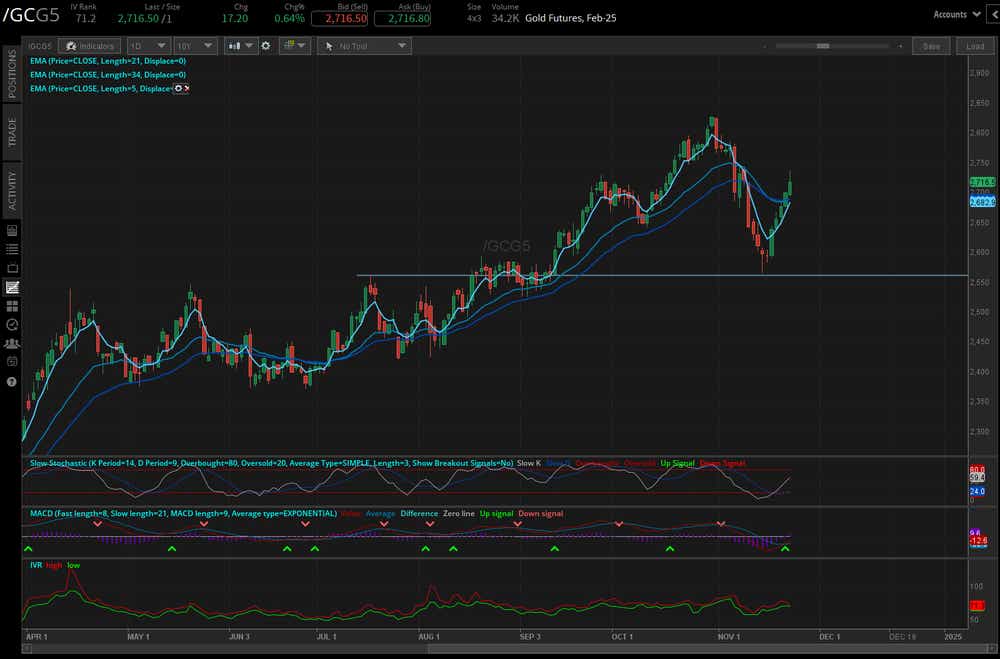
/GCG5 | +0.78% |
/SIH5 | +0.91% |
/HGH5 | -0.58% |
Gold prices (/GCG5) are extending their gains for a sixth consecutive session, erasing more than half the losses that accumulated in the first half of the month (which marked the worst two-week stretch for gold since March 2020). While /GCG5 has exhibited signs of improved technical posture by trading above both its one-week and one-month moving averages, silver prices (/SIH5) have no such clarity thus far, remaining trapped between their one-week and one-month moving averages.
Strategy (67DTE, ATM) | Strikes | POP | Max Profit | Max Loss |
Iron Condor | Long 2525 p Short 2550 p Short 2900 c Long 2925 c | 64% | +680 | -1820 |
Short Strangle | Short 2550 p Short 2900 c | 71% | +3590 | x |
Short Put Vertical | Long 2525 p Short 2550 p | 83% | +360 | -2140 |
Symbol: Energy | Daily Change |
/CLF5 | -0.11% |
/HOF5 | -0.68% |
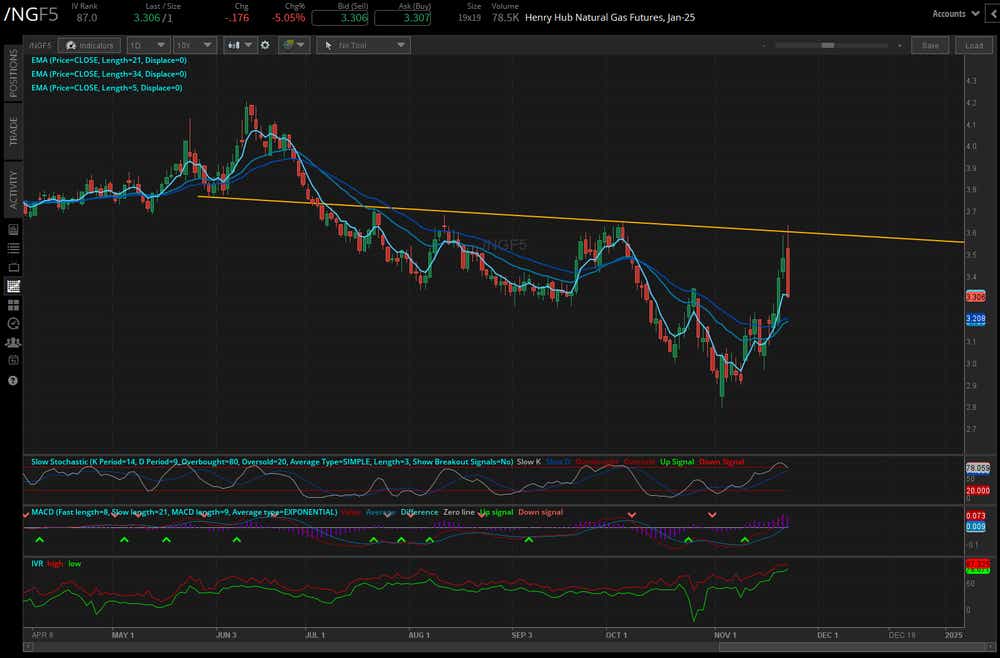
/NGF5 | -4.52% |
/RBF5 | -0.54% |
Natural gas prices (/NGF5) have had a rollercoaster week, gaining overn22% at one point before crashing back to earth: /NGF5 is up by just over 8% week-to-date, a dramatic turn from this time yesterday. Evolving geopolitical concerns in Eastern Europe plus a shift in NOAA’s temperature forecast for the lower 48 states have proved vital catalysts in recent days, and that’s likely to continue into the holiday-shortened week.
Strategy (54DTE, ATM) | Strikes | POP | Max Profit | Max Loss |
Iron Condor | Long 61 p Short 63 p Short 79 c Long 81 c | 61% | +490 | -1510 |
Short Strangle | Short 63 p Short 79 c | 69% | +1830 | x |
Short Put Vertical | Long 61 p Short 63 p | 77% | +320 | -1680 |
Symbol: FX | Daily Change |
/6AZ4 | -0.15% |
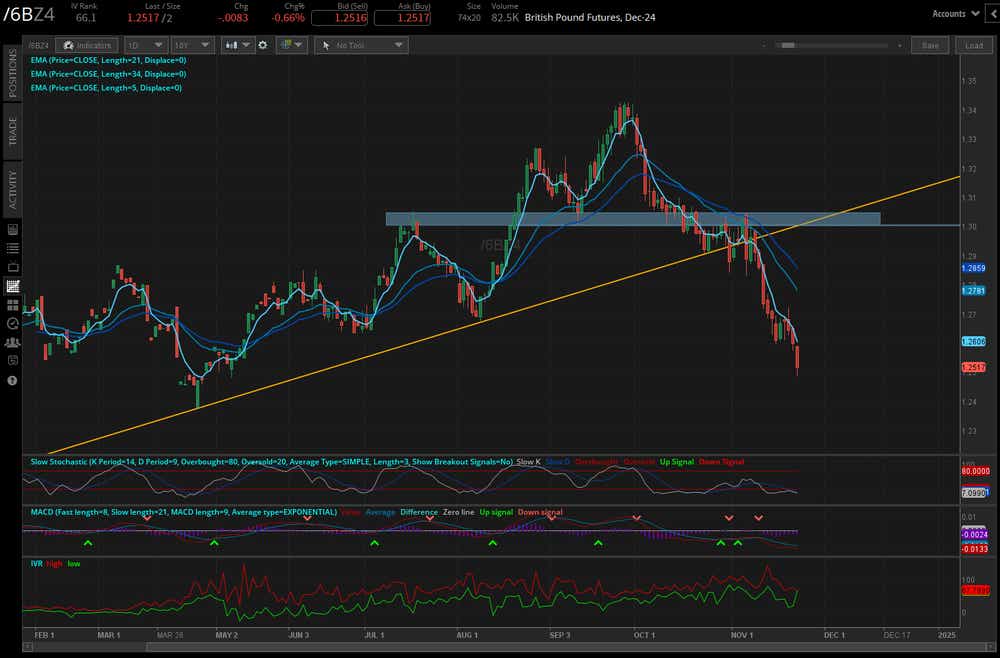
/6BZ4 | -0.59% |
/6CZ4 | -0.07% |
/6EZ4 | -0.51% |
/6JZ4 | +0.08% |
If only to underscore the problems facing the European currencies, on a day when U.S. Treasury yields are lower and energy prices are lower, both the British pound (/6BZ4) and the euro (/6EZ4) are leading the major currencies to the downside. These are pure bearish momentum plays at the moment (in other words, there’s no reason to try to sell puts to call the low absent technical evidence), with continued persistence of aggressively oversold readings across myriad indicators.
Strategy (42DTE, ATM) | Strikes | POP | Max Profit | Max Loss |
Iron Condor | Long 1.21 p Short 1.22 p Short 1.28 c Long 1.29 c | 65% | +175 | -450 |
Short Strangle | Short 1.22 p Short 1.28 c | 70% | +418.75 | x |
Short Put Vertical | Long 1.21 p Short 1.22 p | 88% | +87.50 | -537.50 |
Christopher Vecchio, CFA, tastylive’s head of futures and forex, has been trading for nearly 20 years. He has consulted with multinational firms on FX hedging and lectured at Duke Law School on FX derivatives. Vecchio searches for high-convexity opportunities at the crossroads of macroeconomics and global politics. He hosts Futures Power Hour Monday-Friday and Let Me Explain on Tuesdays, and co-hosts Overtime, Monday-Thursday. @cvecchiofx
For live daily programming, market news and commentary, visit tastylive or the YouTube channels tastylive (for options traders), and tastyliveTrending for stocks, futures, forex & macro.
Trade with a better broker, open a tastytrade account today. tastylive, Inc. and tastytrade, Inc. are separate but affiliated companies.
Options involve risk and are not suitable for all investors. Please read Characteristics and Risks of Standardized Options before deciding to invest in options.
tastylive content is created, produced, and provided solely by tastylive, Inc. (“tastylive”) and is for informational and educational purposes only. It is not, nor is it intended to be, trading or investment advice or a recommendation that any security, futures contract, digital asset, other product, transaction, or investment strategy is suitable for any person. Trading securities, futures products, and digital assets involve risk and may result in a loss greater than the original amount invested. tastylive, through its content, financial programming or otherwise, does not provide investment or financial advice or make investment recommendations. Investment information provided may not be appropriate for all investors and is provided without respect to individual investor financial sophistication, financial situation, investing time horizon or risk tolerance. tastylive is not in the business of transacting securities trades, nor does it direct client commodity accounts or give commodity trading advice tailored to any particular client’s situation or investment objectives. Supporting documentation for any claims (including claims made on behalf of options programs), comparisons, statistics, or other technical data, if applicable, will be supplied upon request. tastylive is not a licensed financial adviser, registered investment adviser, or a registered broker-dealer. Options, futures, and futures options are not suitable for all investors. Prior to trading securities, options, futures, or futures options, please read the applicable risk disclosures, including, but not limited to, the Characteristics and Risks of Standardized Options Disclosure and the Futures and Exchange-Traded Options Risk Disclosure found on tastytrade.com/disclosures.
tastytrade, Inc. ("tastytrade”) is a registered broker-dealer and member of FINRA, NFA, and SIPC. tastytrade was previously known as tastyworks, Inc. (“tastyworks”). tastytrade offers self-directed brokerage accounts to its customers. tastytrade does not give financial or trading advice, nor does it make investment recommendations. You alone are responsible for making your investment and trading decisions and for evaluating the merits and risks associated with the use of tastytrade’s systems, services or products. tastytrade is a wholly-owned subsidiary of tastylive, Inc.
tastytrade has entered into a Marketing Agreement with tastylive (“Marketing Agent”) whereby tastytrade pays compensation to Marketing Agent to recommend tastytrade’s brokerage services. The existence of this Marketing Agreement should not be deemed as an endorsement or recommendation of Marketing Agent by tastytrade. tastytrade and Marketing Agent are separate entities with their own products and services. tastylive is the parent company of tastytrade.
tastyfx, LLC (“tastyfx”) is a Commodity Futures Trading Commission (“CFTC”) registered Retail Foreign Exchange Dealer (RFED) and Introducing Broker (IB) and Forex Dealer Member (FDM) of the National Futures Association (“NFA”) (NFA ID 0509630). Leveraged trading in foreign currency or off-exchange products on margin carries significant risk and may not be suitable for all investors. We advise you to carefully consider whether trading is appropriate for you based on your personal circumstances as you may lose more than you invest.
tastycrypto is provided solely by tasty Software Solutions, LLC. tasty Software Solutions, LLC is a separate but affiliate company of tastylive, Inc. Neither tastylive nor any of its affiliates are responsible for the products or services provided by tasty Software Solutions, LLC. Cryptocurrency trading is not suitable for all investors due to the number of risks involved. The value of any cryptocurrency, including digital assets pegged to fiat currency, commodities, or any other asset, may go to zero.
© copyright 2013 - 2025 tastylive, Inc. All Rights Reserved. Applicable portions of the Terms of Use on tastylive.com apply. Reproduction, adaptation, distribution, public display, exhibition for profit, or storage in any electronic storage media in whole or in part is prohibited under penalty of law, provided that you may download tastylive’s podcasts as necessary to view for personal use. tastylive was previously known as tastytrade, Inc. tastylive is a trademark/servicemark owned by tastylive, Inc.