S&P 500, Nasdaq 100 End Summer on Stronger Technical Footing

S&P 500, Nasdaq 100 End Summer on Stronger Technical Footing
But September is typically the worst month of the year for the markets
Both the S&P 500 (/ESU4) and Nasdaq 100 (/NQU4) enjoyed a late-day rally—short-covering ahead of the holiday weekend—to close the week near the highs.
The Russell 2000 (/RTYU4) is exhibiting signs of improving technical momentum.
But the better technical footing heading into September comes into conflict with a difficult seasonality backdrop.
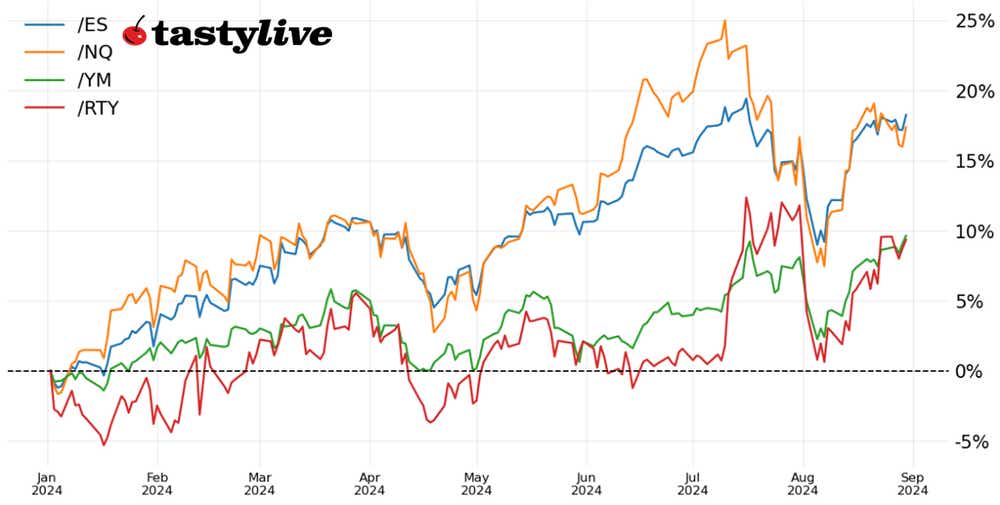
Market Update: S&P 500 finishes up by 1.81% in August
The rollercoaster ride that was August 2024 has come to an end. That’s not unusual per se, given the fact that August has typically produced the biggest rise in volatility (on a percentage basis) of any month over the past 10 years and 20 years. Nevertheless, both the S&P 500 (/ESU4) and Nasdaq 100 (/NQU4) are closing the week and month near the highs: after being down by 8.16% for the month early on Aug. 5, the /ESU4 is finishing the month higher by 1.81%.
The improved technical structures in place at the end of August would lead many to believe that the path is clear ahead. But that doesn’t mean stocks are out of the woods yet. September is typically the worst month of the year. Seasonality aside, the prospect of the onset of a Federal Reserve rate cut cycle for good reasons or bad will come squarely into focus on Sept. 6, when the August U.S. nonfarm payrolls report is released.
As the saying goes, “the best time to buy flood insurance is before it rains,” it stands to reason that traders may look upon the improved technical structures and decimation in volatility with skepticism and instead use the opportunity to reduce the beta-weighted delta of their portfolio either by taking profit on short volatility/long equity positions established in early-August or buy cheaper OTM puts as protection for what September may bring. But for those who stay mechanically within a technical system, the bulls remain tentatively in control.
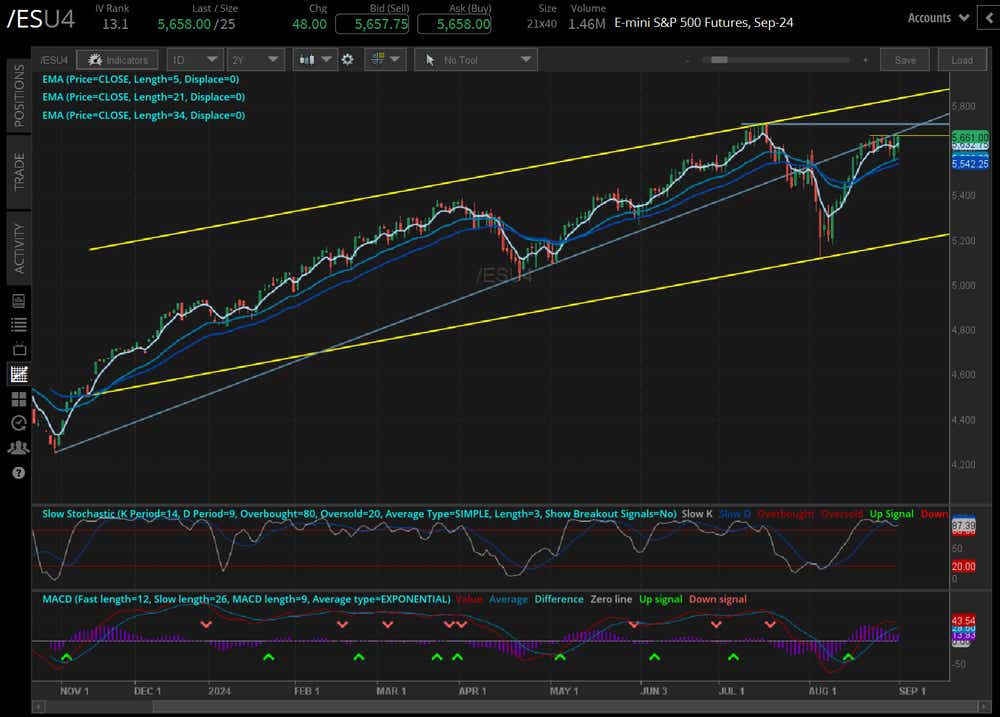
/ES S&P 500 Price Technical Analysis: Daily Chart (October 2023 to June 2024)
Technically, the S&P 500’s (/ESU4) technical structure has not changed since the start of the week, when we noted that /ESU4 “is trading above its daily five-EMA, daily 21-EMA and daily 34-EMA; the EMAs are in bullish sequential order. Slow stochastics are trending higher into overbought condition, a positive sign for momentum. MACD (moving average convergence/divergence) is trending higher through its signal line. Volatility has come down and remained lower (implied volatility rank, or IVR: 18.7) after its spike early this month. In tandem, the momentum profile and volatility environment are beginning to favor ATM call spreads in /ESU4 (as opposed to short put spreads) to express a bullish bias.” Until the Aug.1 swing high of 5600.75 is broken on a daily closing basis, longs will remain appropriate.
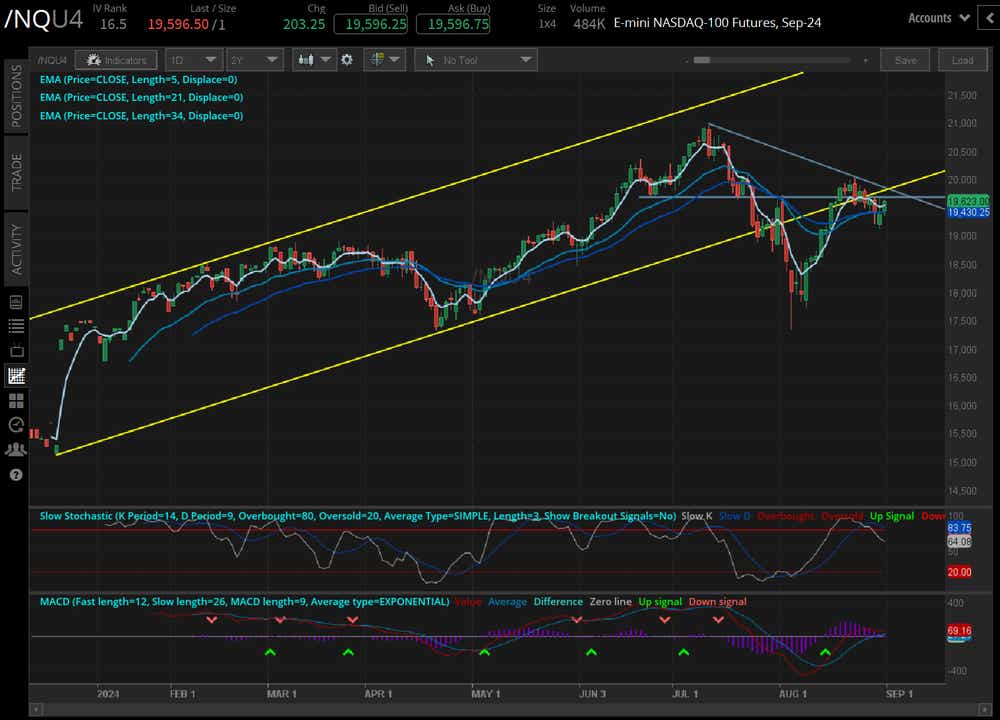
/NQ Nasdaq 100 Price Technical Analysis: Daily Chart (October 2023 to June 2024)
Heading into next week, it remains the case that “the Nasdaq 100 (/NQU4) has a less bullish outlook than /ESU4.”
However, /NQU4 is trading above its daily five-EMA, daily 21-EMA and daily 34-EMA; the EMAs are in bullish sequential order with positive slopes, suggesting that momentum has been reestablished. MACD’s move through its signal line has stalled and is no longer narrowing. However, Slow stochastics are declining after an exit from overbought territory.
Improvements in the momentum profile aside, there are evidently several conflicting signals. Simple technical levels may provide a better guidepost in the short-term. To wit, the area around 19690/730 has produced numerous highs and lows since late-June: above this area, particularly on the other side of the U.S. jobs report next Friday, and bullish will be in full control; failure to retake 19690/730 in the coming days will keep intact an equal possibility that the next significant directional move will be lower.
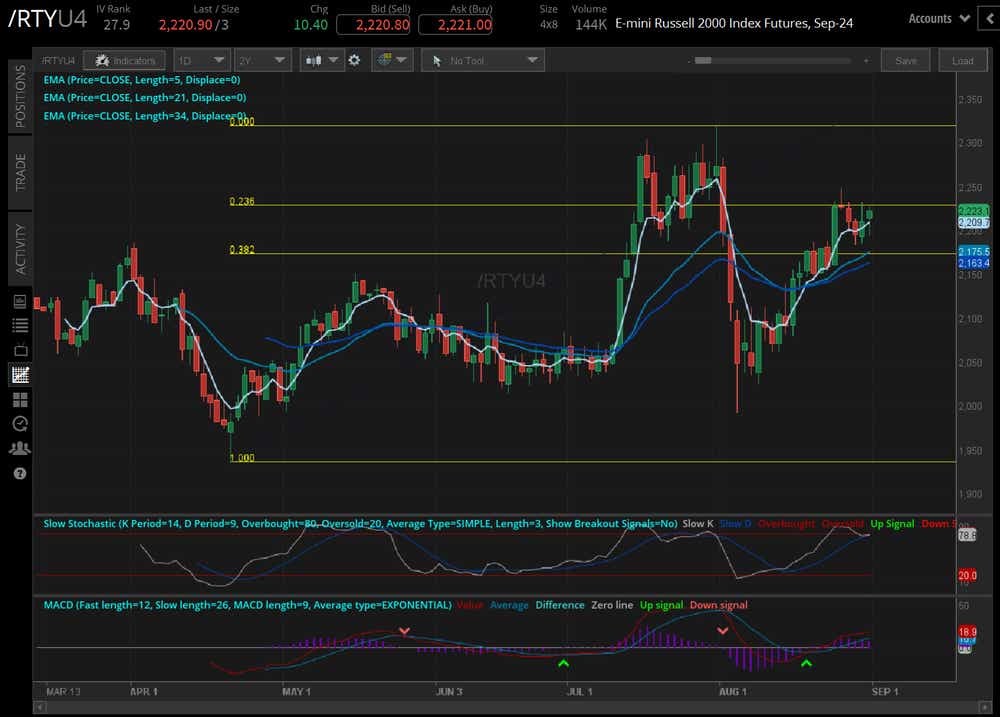
/RTY Russell 2000 Price Technical Analysis: Daily Chart (October 2023 to June 2024)
The Russell 2000 (/RTYU4) continues to hold a bullish technical setup in the short-term. After finding resistance at the 23.6% Fibonacci retracement of the six-month high/low range, the pullback in /RTYU4 never exceeded the 38.2% retracement on the way down, and likewise, /RTYU4 continues to trade its daily EMA cloud, which is in bullish sequential order. Slow stochastics are holding in overbought condition, while MACD is trending higher above its signal line. Volatility remains is coming down (IVR: 27.9), making both iron condors and short put spreads less appropriate strategies than they were at the start of the final week of August.
Christopher Vecchio, CFA, tastylive’s head of futures and forex, has been trading for nearly 20 years. He has consulted with multinational firms on FX hedging and lectured at Duke Law School on FX derivatives. Vecchio searches for high-convexity opportunities at the crossroads of macroeconomics and global politics. He hosts Futures Power Hour Monday-Friday and Let Me Explain on Tuesdays, and co-hosts Overtime, Monday-Thursday. @cvecchiofx
For live daily programming, market news and commentary, visit tastylive or the YouTube channels tastylive (for options traders), and tastyliveTrending for stocks, futures, forex & macro.
Trade with a better broker, open a tastytrade account today. tastylive, Inc. and tastytrade, Inc. are separate but affiliated companies.
Options involve risk and are not suitable for all investors. Please read Characteristics and Risks of Standardized Options before deciding to invest in options.