S&P 500 Charts New Highs—Will the Nasdaq 100 and Russell 200 Follow?

S&P 500 Charts New Highs—Will the Nasdaq 100 and Russell 200 Follow?
Either way, this month seems to have broken with the usual scenario for September
The final stretch of weak September seasonality is here: The week after options expiry tends to produce weaker conditions for stocks.
The S&P 500 (/ESZ4) set new all-time and yearly closing highs over the course of the week, finishing higher by 2.3%.
However, the Nasdaq 100 (/NQZ4) and Russell 2000 (/RTYZ4) have yet to clear their July highs.
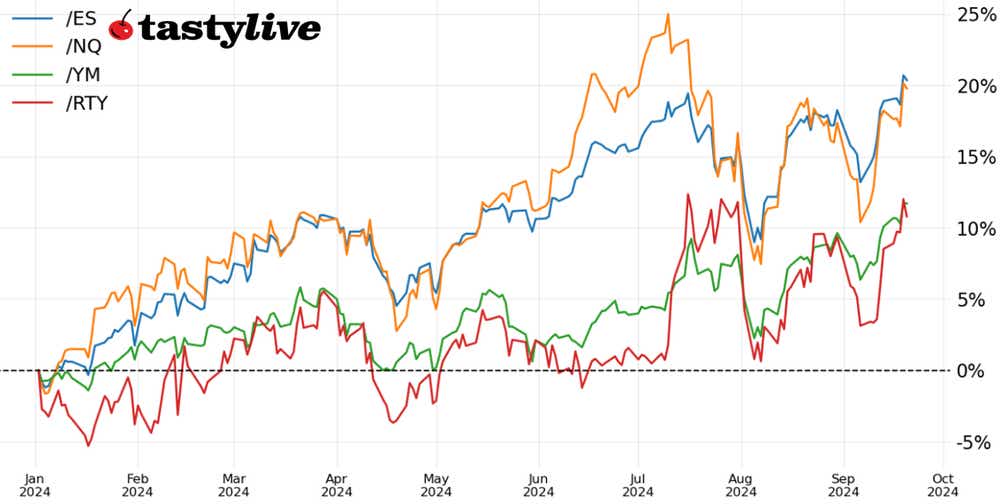
Market Update: S&P 500 up 1.73% month-to-date
The final week of September beckons, and it’s usually a bad one: According to the Stock Trader’s Almanac, the week after the September option expiration has produced an average loss of 0.76% since 1982, falling 69% of the time.
But seasonality has been an unreliable narrator for this month of September, supposedly the worst month of the year. Volatility has collapsed further from its early-September peak, while the S&P 500 (/ESZ4) has marched to new all-time highs.
For those compelled to point to the Federal Reserve’s 50-basis-point (bps) rate cut as a reason to be wary, consider two facts. First, the S&P 500 has averaged a three-month return of 4% when the Fed cuts for “maintenance” reasons (as opposed to “recession” reasons). Second, when the Fed has cut rates while the S&P 500 has been within 2% of all-time highs, the index has traded higher one-year later 100% of the time, per Carson Research.
Heading into the last week of September, the technical structures that were already improving by this time last week are now on even stronger footing. Whereas last week it was still reasonable to look at the charts with some degree of caution, the moves by the end of this week suggest bulls may be on parade soon.
/ES S&P 500 Price Technical Analysis: Daily Chart (October 2023 to September 2024)
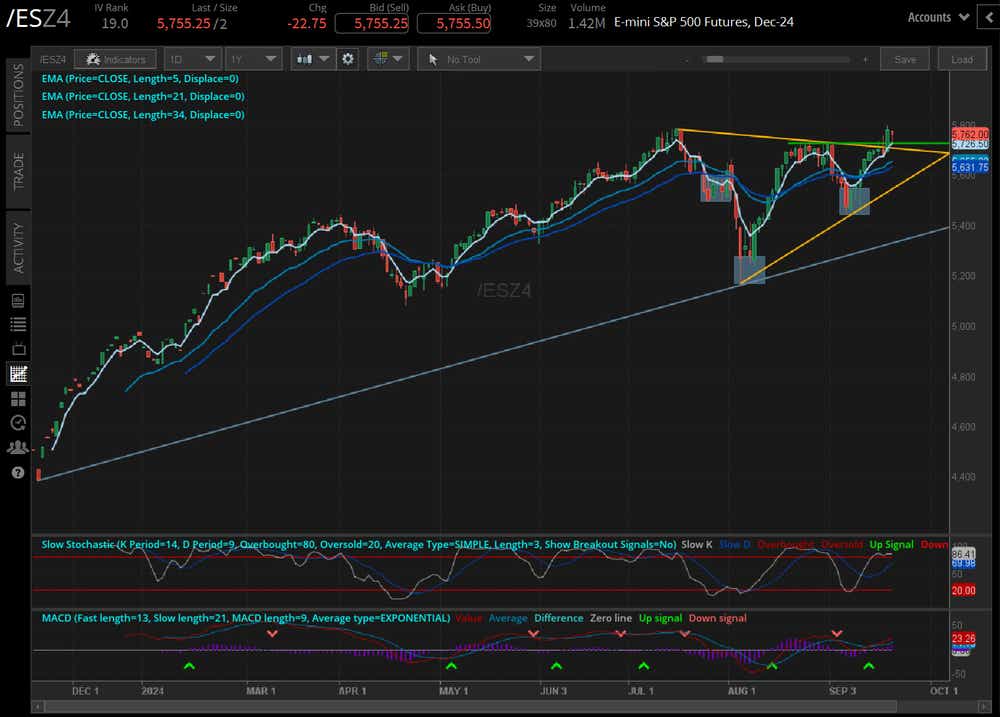
The S&P 500’s (/ESZ4) rally has cleared several technical hurdles in recent days: 5670, the September high; the downtrend from the July and September highs; and the all-time high set in July at 5785. The final hurdle to fall would be uptrend from the October 2023 and July 2024 lows, which has proved resistance in recent days.
Nevertheless, it’s difficult to make anything other than a bullish case, from a technical perspective, when a market is at all-time highs. The momentum profile is strong, with /ESZ4 still trading above its daily 5-, 21- and 34-exponential moving average (EMA) cloud, which is in bullish sequential order. Slow stochastics are trending higher through into overbought territory, and MACD,—short for moving average convergence/divergence,—is trending higher above its median line. Volatility remains low (IVR: 19) and the the Cboe Volatility Index, or VIX, is slowly creeping back toward 15.
As noted last week, if /ESZ4 “were to break above 5670, it would appear that an inverse head and shoulders pattern, or a symmetrical triangle, breakout would be in the cards. The measured move higher … above 6100, and perhaps 6300, into the end of the year. If the breakout were to transpire alongside a drop in the VIX below 15, it would be suitable to express bullishness through at-the-money (ATM) calls (or call spreads).” As it were.
/NQ Nasdaq 100 Price Technical Analysis: Daily Chart (April to September 2024)
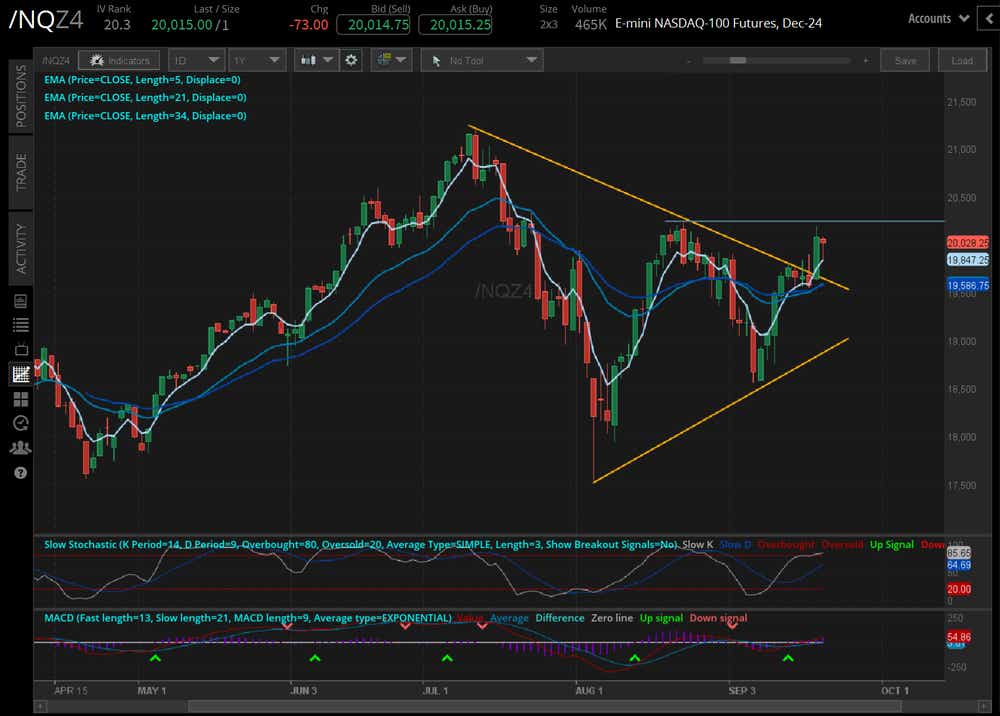
The technical outlook for the Nasdaq 100 (/NQZ4) is something of a hybrid between /ESZ4 and the Russell 2000 (/RTYZ4). A triangle breakout has occurred, but it has not cleared recent swing highs nor has a new yearly or all-time high been established by /NQZ4. Momentum is improving, with the daily-5 EMA (one-week moving average) having held as support on a closing basis every session since Sept. 10. As observed previously, “in clearing the Sept. 3 high, [/NQZ4] would break the bearish engulfing bar that marked the monthly high and set up a return to the Aug. 22 bearish key reversal candlestick high at 20025.25.” This remains the outlook; clearing the Aug. 22 high paves the path for a return to the all-time high.
/RTY Russell 2000 Price Technical Analysis: Daily Chart (June to September 2024)
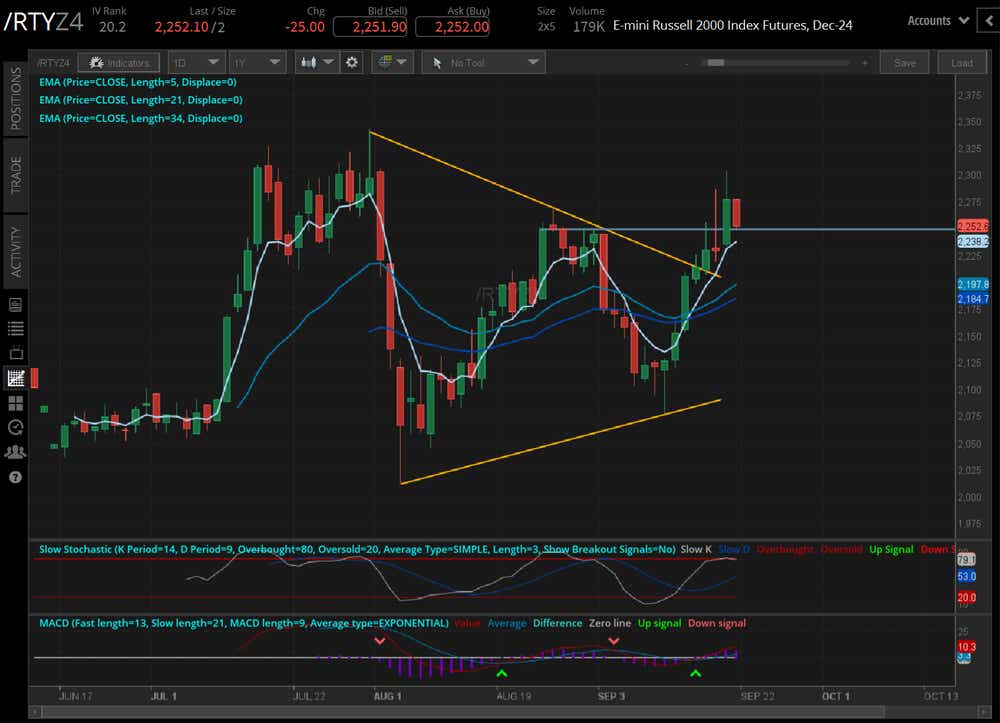
Wash, rinse, repeat for the Russell 2000 (/RTYZ4). Like its predecessors, /RTYZ4 broke out of a symmetrical triangle this week. Unlike /NQZ4, /RTYZ4 did clear its recent swing highs; unlike /ESZ4, /RTYZ4 did not set new yearly or all-time highs. The more directionally bullish technical structure alongside the drop in volatility (IVR: 20.2) has rendered directionally neutral vol selling strategies (like iron condors) less appealing.
Christopher Vecchio, CFA, tastylive’s head of futures and forex, has been trading for nearly 20 years. He has consulted with multinational firms on FX hedging and lectured at Duke Law School on FX derivatives. Vecchio searches for high-convexity opportunities at the crossroads of macroeconomics and global politics. He hosts Futures Power Hour Monday-Friday and Let Me Explain on Tuesdays, and co-hosts Overtime, Monday-Thursday. @cvecchiofx
For live daily programming, market news and commentary, visit tastylive or the YouTube channels tastylive (for options traders), and tastyliveTrending for stocks, futures, forex & macro.
Trade with a better broker, open a tastytrade account today. tastylive, Inc. and tastytrade, Inc. are separate but affiliated companies.
Options involve risk and are not suitable for all investors. Please read Characteristics and Risks of Standardized Options before deciding to invest in options.