S&P 500 and VIX Analysis: The Current Sentiment Goes Beyond Fear; We Are Now in a State of Panic

S&P 500 and VIX Analysis: The Current Sentiment Goes Beyond Fear; We Are Now in a State of Panic
Will the bulls return after the market panic sets off by the tariffs Announcement?
U.S. stock are markets are in panic mode as investors continue to assess the fallout from this week’s White House’s tariff announcement. China retaliated overnight, which injected additional uncertainty into the economic outlook. Growth is expected to slow as trade restrictions throttle global trade.
Early today, the S&P 500 fell into it lowest levels since August. Traders trimmed some of those gains into the afternoon, but futures (/ESM5) were still down by about 3% by noon. Meanwhile, the Chicago Board Options Exchange’s VIX index, or fear gauge, rose over 30% to above the 40 handle, hitting the highest level since August 2024.
The current market move goes beyond fear; we are now in a stage of panic. Going back to 2006, the VIX has only traded above the 30 level 435 times. We’ll take a quick look at the historical levels of the VIX and compare them to the 21-day forward returns in the S&P 500 based on the SPX.
Analyzing S&P 500 returns following extreme volatility
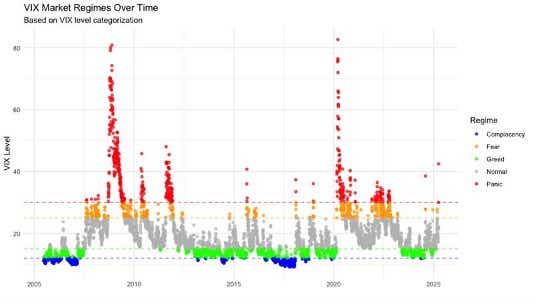
We’ll define market regimes based on VIX levels and show the number of occurrences back to 2006 as follows:
- Panic: VIX above 30; n=435
- Fear: VIX 25 to 30; n=413
- Normal: VIX 15 to 25; n=2,252
- Greed: VIX 12 to 15; n=1,331
- Complacency: VIX under 12; n=527
We can see most of VIX behavior is concentrated in the normal and greed regimes between a VIX level of 12 and 25.
However, events where the VIX spikes above 25 become much less common. When the VIX rises above 25, this represents fear in the market, and a level above 30 represents panic. The chart below shows the VIX level defined by these market regimes.
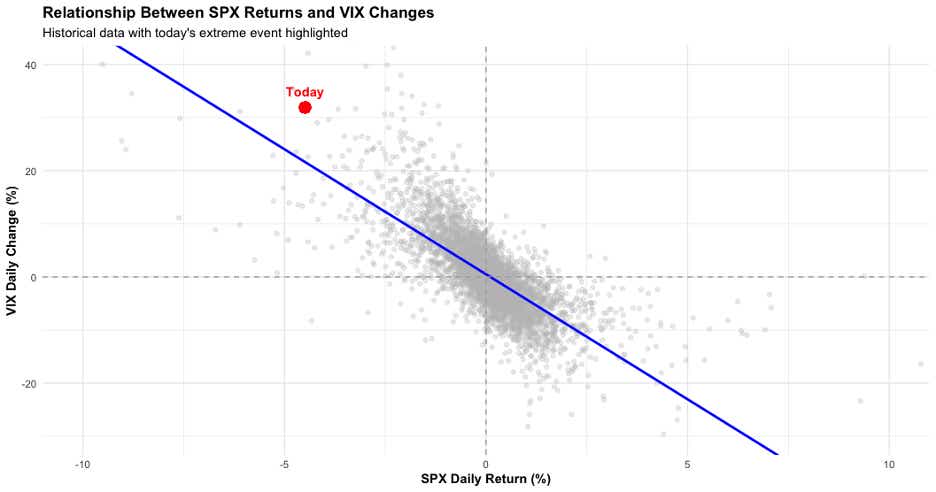
The correlation between volatility and equity prices is negative, meaning that equity prices drop as the VIX rises. This relationship is represented in the linear regression model below.
Notably, today’s event (the red dot on the chart) is to the left and above the regression line. This indicates he move in the VIX was more extreme based on the move in the S&P 500. This means there might be some excess volatility in the market.
However, volatility extremes like those we are seeing this week are typically short lived. If we look at the decay curve of the VIX following one-day spikes of 30% or more in a single day, which is a rare occurrence with only 39 events going back to 2006, we see that the VIX typically falls after such an event.
The chart below plots the path of the VIX in the 30 days following those 39 events, with the VIX level normalized to 100%. The median decay path (purple line) shows the VIX falls to about 85% of its spike level within just a few days of the event. It continues to fall to 70% to 75% by the 30-day mark.
This analysis suggests the VIX will most likely fall, but four times the VIX has finished higher 30 days after the event, and the distribution of decay is rather wide. If we are basing a trade on the median path, however, we can be fairly confident the VIX will drop over the next 30 days.
We already know equity prices typically rise when the VIX falls based on the regression analysis above. But let’s look at the returns of the S&P 500 following our defined VIX regime levels.
The S&P 500 returns 3.0% on a median basis in the 21 days following a panic regime, and 3.2% following a fear regime. Since the VIX rose above 25 (fear) on Thursday and continued to rise above the 30 level (panic) today, we can split the difference and infer that the 21-day return following this week’s event would result in a 3.1% return in 21 days based on the historical performances.
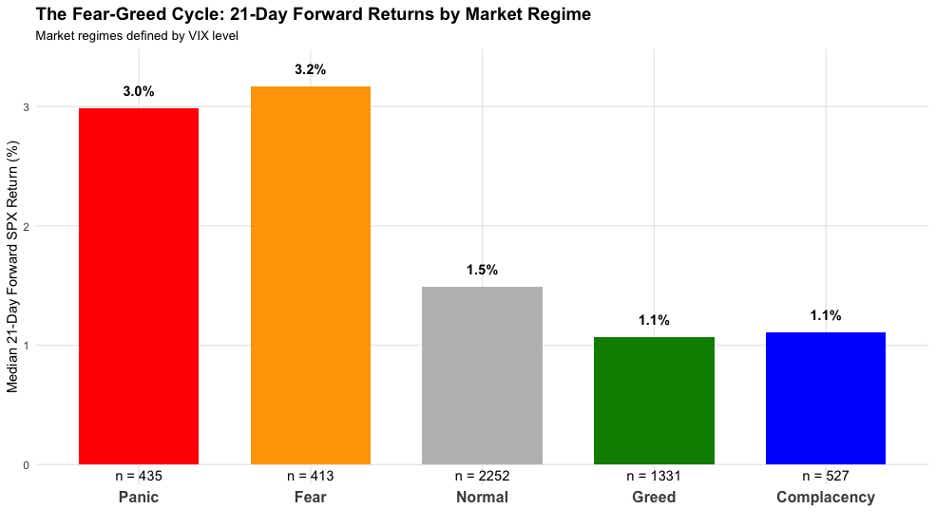
What does this mean for trading the S&P 500? If we hinge our bets on the historical data, it means that it could be a good trade to get long the S&P 500. With volatility elevated, a strategy to take advantage of a pullback in volatility would likely be optimal. That said, selling a put, or selling a put spread for a defined risk trade could be an enticing strategy.
Thomas Westwater, a tastylive financial writer and analyst, has eight years of markets and trading experience. #@fxwestwater
For live daily programming, market news and commentary, visit tastylive or the YouTube channels tastylive (for options traders), and #tastyliveTrending for stocks, futures, forex & macro.
Trade with a better broker, open a tastytrade account today. tastylive Inc. and tastytrade Inc. are separate but affiliated companies.
Options involve risk and are not suitable for all investors. Please read Characteristics and Risks of Standardized Options before deciding to invest in options.