Natural Gas Prices Remain Hot

Natural Gas Prices Remain Hot
Natural gas futures (/NG) are hot, up 3 cents at $2.757 through Tuesday afternoon trading. What can traders expect?
- Natural gas futures rise on weather outlook.
- Hotter-than-average temps to support bull case.
- The technical outlook remains bullish as key levels clear.
Natural gas futures (/NG) are up 3 cents, or about 1.2%, to trade at $2.757 per million British thermal units (mmbtu) through Tuesday afternoon trading. This move extends Monday’s price action when the commodity rose nearly 6% to the highest levels traded since the middle of July and puts the weekly gain on track to record the biggest gain since early June.
What is driving gas prices higher?
The explanation for higher natural gas prices is straightforward: unusually hot weather. Across the globe, July was officially the hottest month on record. The European Union’s Copernicus monitoring service stated Tuesday that July’s global average saw 16.95 degrees Celsius.
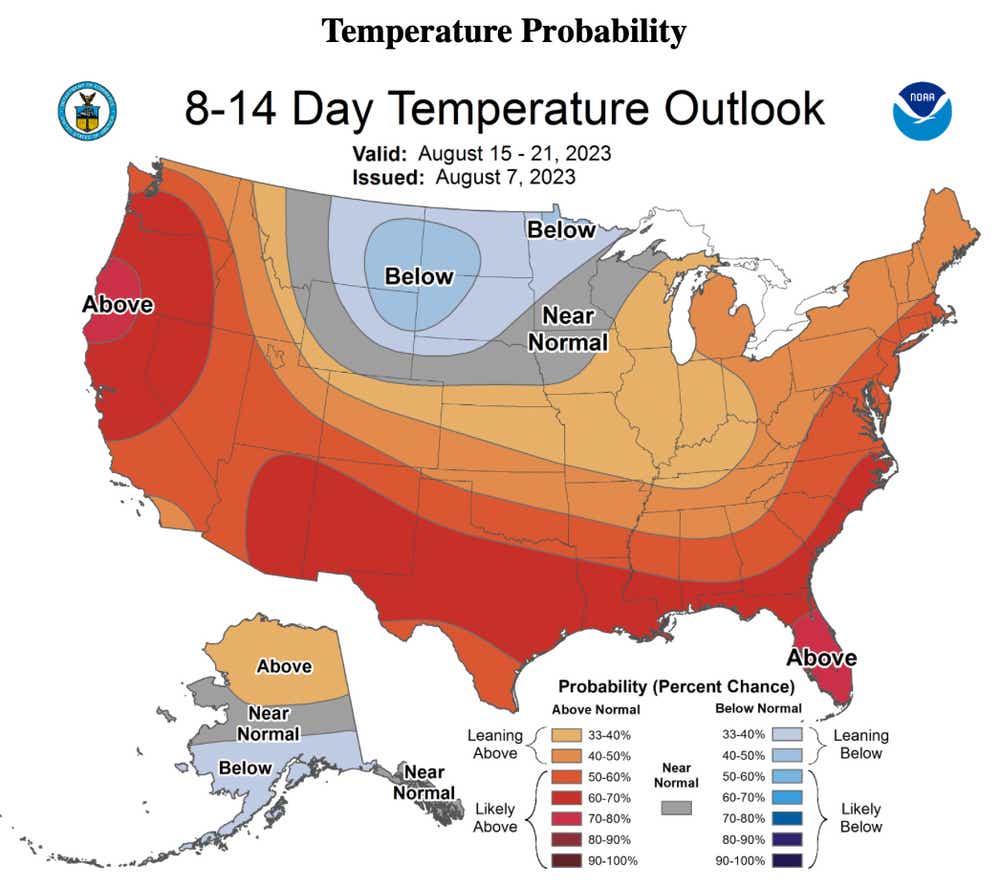
That has strained the energy grid as people turn to air conditioning to escape the record-breaking heat. Unfortunately, higher-than-average mercury readings are expected to continue across much of the United States as the broader energy market remains resilient. According to the NOAA/ National Weather Service’s eight to 14-day temperature outlook, there is an above-normal chance for hotter-than-average temperatures across much of the continental U.S. (see map image below).
While the heat has supported prices this summer, the storage surplus in the U.S. has kept a lid on the upside. While natural gas stocks rose modestly for the week ending July 28 at +14 billion cubic feet (bcf) versus an expected +17 bcf, a large storage surplus remains.
According to data from the Energy Information Administration (EIA), U.S. stockpiles are 550 bcf higher than this time last year, and production rose by 0.8% to an average of 102.5 bcf per day (bcf/d). While that is encouraging, demand rose 0.9% from the week prior. The EIA will update its data on August 10. Otherwise, it’s a subdued week for known headline risks to the market.
If demand continues to outpace supply—and that appears to be the case if weather forecasts play out—prices should rise in the coming week.
Natural gas technical outlook
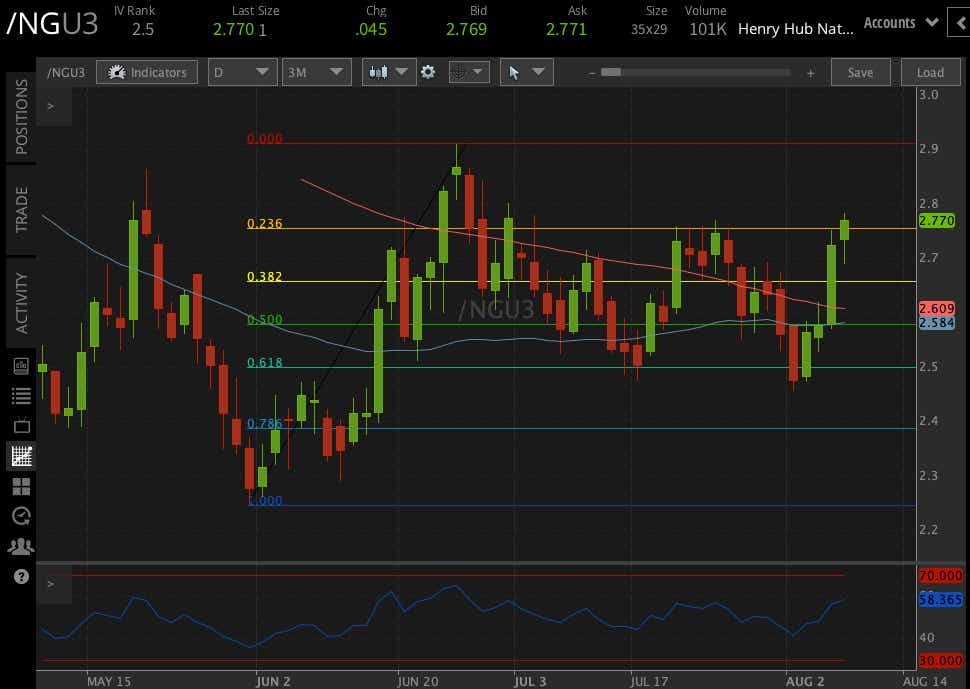
Monday’s move saw prices pierce above the 50- and 100-day simple moving averages, as well as the pseudo 50% Fibonacci retracement level and the 38.2% retracement from the May to June range. Today, bulls are attempting a close above the 23.6% retracement, which would leave prices on a bullish footing. Fibonacci retracement is a method of technical analysis for determining support and resistance levels.
Thomas Westwater, a tastylive financial writer and analyst, has eight years of markets and trading experience. @fxwestwater
For live daily programming, market news and commentary, visit tastylive or the YouTube channels tastylive (for options traders), and tastyliveTrending for stocks, futures, forex & macro.
Trade with a better broker, open a tastytrade account today. tastylive, Inc. and tastytrade, Inc. are separate but affiliated companies.
Options involve risk and are not suitable for all investors. Please read Characteristics and Risks of Standardized Options before deciding to invest in options.