Natural Gas Bulls Relent Following U.S. Inventory Data

Natural Gas Bulls Relent Following U.S. Inventory Data
But macro factors support higher prices
- Hot weather is increasing demand for the natural gas that generates electricity.
- Today’s move takes natural gas prices close to last week’s July swing low at 2.536. A break below that level could spur some additional downside.
- Bulls may decide to regroup for the next push higher in natural gas prices.
Natural gas prices erase weekly gain
U.S. natural gas futures (/NG) have risen steadily this summer, but prices remain well below levels from last year. Since April, futures prices have risen more than 20%, from $1.946 per million British thermal units (mmBtu) to as high as $2.878 by late June.
As of Thursday, prices are trading about 2% lower on the day to around the $2.579 level, which extinguishes the weekly gain that was intact before today’s inventory report. This follows last week’s 7.72% decline, which broke a four-week win streak. Will prices decline further?
Macro factors suggest pullback is temporary
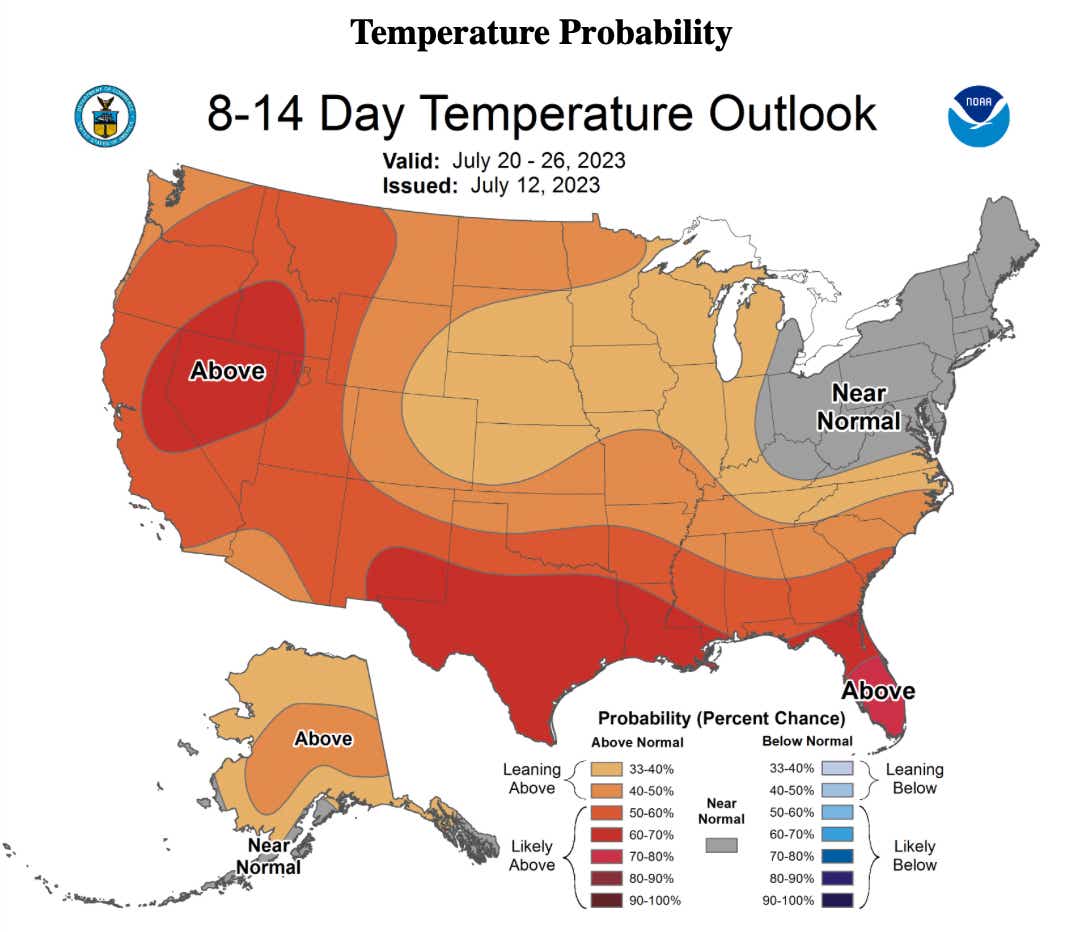
It has been a very hot summer in the United States and that heat is expected to continue, according to short-term forecasting models. Hotter-than-average temperatures increase cooling demand, and with natural gas accounting for nearly 40% of U.S. energy generation, the commodity is in high demand.
In the image below, we see the National Oceanic and Atmospheric Administration’s eight-to-14-Day Temperature Outlook forecasts an above-normal probability for above-average temperature across much of the United States. If this forecast proves right, that will mean higher energy demand from cooling for the forecasted period. This should soften the chances of bearish moves occurring over the short term.
EIA inventory report shows smaller-than-expected build
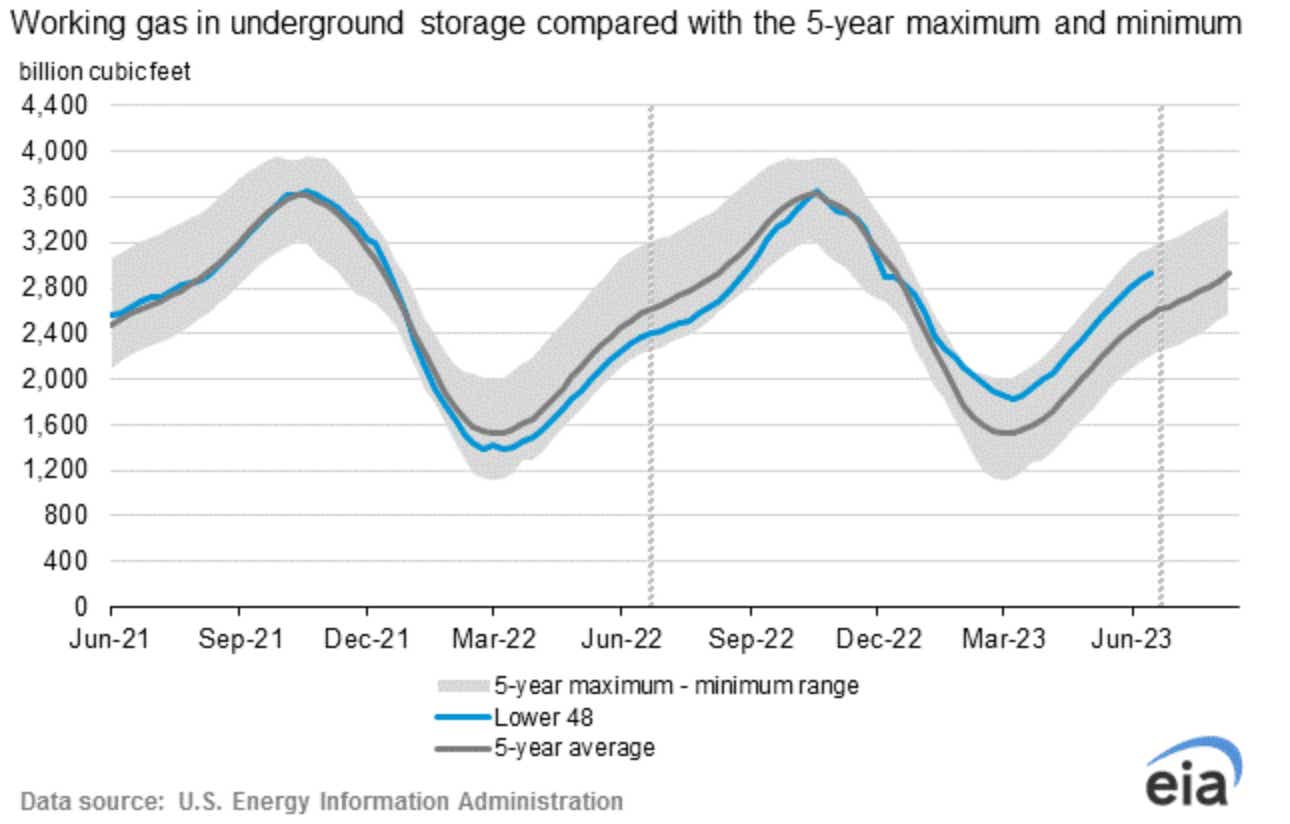
This morning’s inventory report from the U.S. Energy Information Administration (EIA) reflected the effects of higher mercury readings. For the week ending July 7, natural gas injections were at 49 billion cubic feet (Bcf), missing the +51Bcf consensus forecast. A lower injection number typically occurs when energy demand is high.
Despite the smaller-than-expected build, traders started selling after the EIA numbers crossed the wires. Perhaps bulls expected a smaller number? A revision in the data for June 30 changed working gas in storage from 2,877 Bcf to 2,881 Bcf, pushing the total build from that period to +76 Bcf from +72 Bcf.
For July 7, total storage stands at 2,930 Bcf, which puts stocks 569 Bcf higher than this period last year and 364 Bcf higher than the five-year average, according to the EIA.
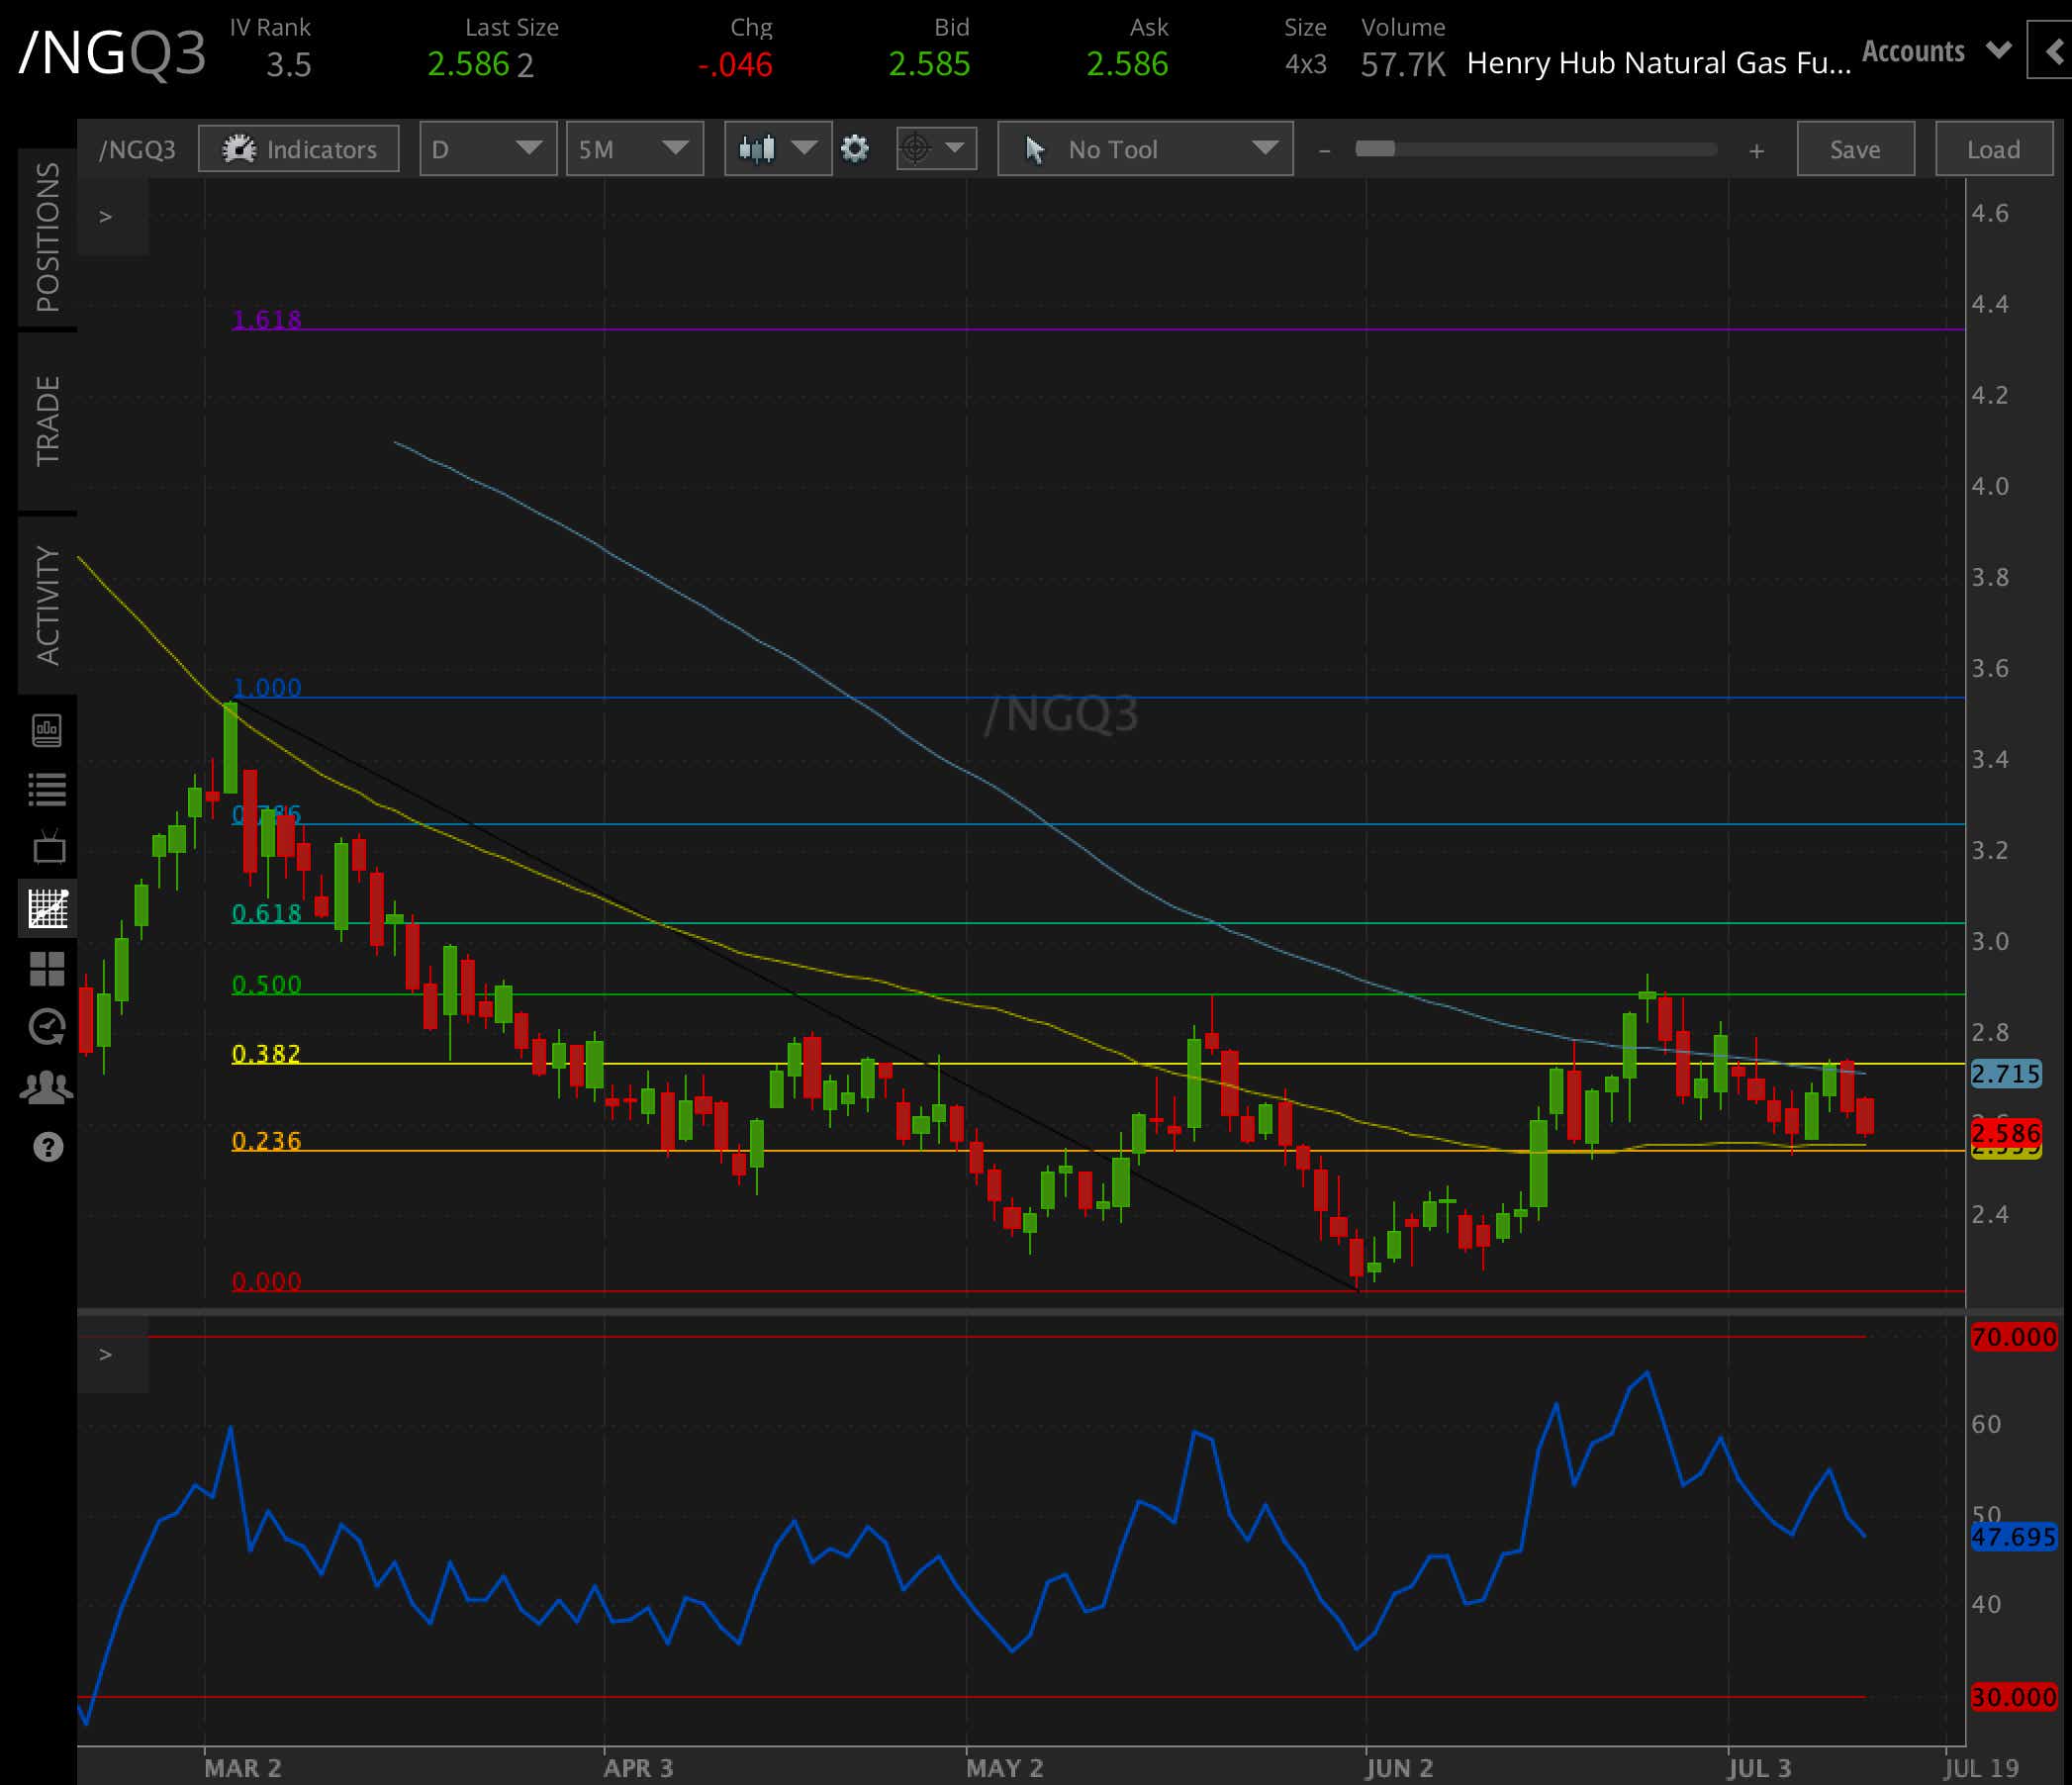
Natural gas technical chart
Today’s move takes prices close to last week’s July swing low at 2.536. A break below that level could spur some additional downside. Alternatively, bulls may decide to regroup at the level for the next push higher. The 50-day Simple Moving Average (SMA) adds some confluence to the possible support level. A bounce higher would look at the falling 100-day SMA and the 38.2% Fibonacci retracement from the March/May move.
Thomas Westwater, a tastylive financial writer and analyst, has eight years of markets and trading experience. @fxwestwater
For live daily programming, market news and commentary, visit tastylive or the YouTube channels tastylive (for options traders), and tastyliveTrending for stocks, futures, forex & macro.
Trade with a better broker, open a tastytrade account today. tastylive, Inc. and tastytrade, Inc. are separate but affiliated companies.
Options involve risk and are not suitable for all investors. Please read Characteristics and Risks of Standardized Options before deciding to invest in options.