Nasdaq 100, S&P 500 Remain Under Pressure In Wake of US CPI Report

Nasdaq 100, S&P 500 Remain Under Pressure In Wake of US CPI Report
Equities continue to push lower in the wake of yesterday’s CPI report, with the S&P 500 and Nasdaq 100 erasing gains from early in the NY session. Risk has been under significant pressure of late, as a plethora of macro concerns weigh on investor sentiment. Wednesday’s session was particularly interesting, as there were violent swings following the release of the highly anticipated CPI data, with stocks ultimately cascading lower throughout the day. Markets may be at a crossroads, as Wednesday’s data did little to answer any questions about “peak inflation.”
For starters, the CPI print is just a single data point. Market participants and Fed officials will need more data to see if inflation is truly rolling over. However, despite the print exceeding expectations on both YoY and MoM metrics, CPI was lower in April than it was in March. Perhaps we can sum up yesterday’s data set as a mixed bag. Risk may largely reflect that sentiment, as the S&P 500 teeters on the verge of a bear market.
Trade Smarter - Sign up for the DailyFX Newsletter
Receive timely and compelling market commentary from the DailyFX team
With so many tech stocks getting kneecapped by the recent rise in interest rates, the Nasdaq 100 continues to suffer severe pain. Thursday’s session saw the index trade below 12000 for the first time since November 2020. More pain may be in store as equity markets have yet to show a sign of true capitulation. That being said, NQ did rally this morning to previous support at 12129. That rally was faded heavily, a true sign of the ‘sell the rally” environment we find ourselves in. Bulls will want to see the session low of 11693.25 hold, but a break could see a flush to fresh yearly-lows.
NASDAQ 100 FUTURES (NQ) 1 HOUR CHART

Chart created with TradingView
The S&P 500 has also received a significant gut check of late, as the large weightings of tech within the index continue to drag the benchmark lower. To put those weights into context, Apple alone constitutes roughly 6% of the index, while the entire energy sector represents 4%. Just like NQ, the S&P 500 failed yet again at prior support, that level being 3960. As all risk continues to look extremely heavy, the S&P 500 may find itself slipping closer to a key area around 3800. 3802 represents the 0.618 Fibonacci retracement of the move from the March 2020 bottom to all-time highs. Investors may be looking to put some dry powder to work in that zone, but should that area fail too, we may be in store for some serious pain.
S&P 500 FUTURES (ES) 1 HOUR CHART
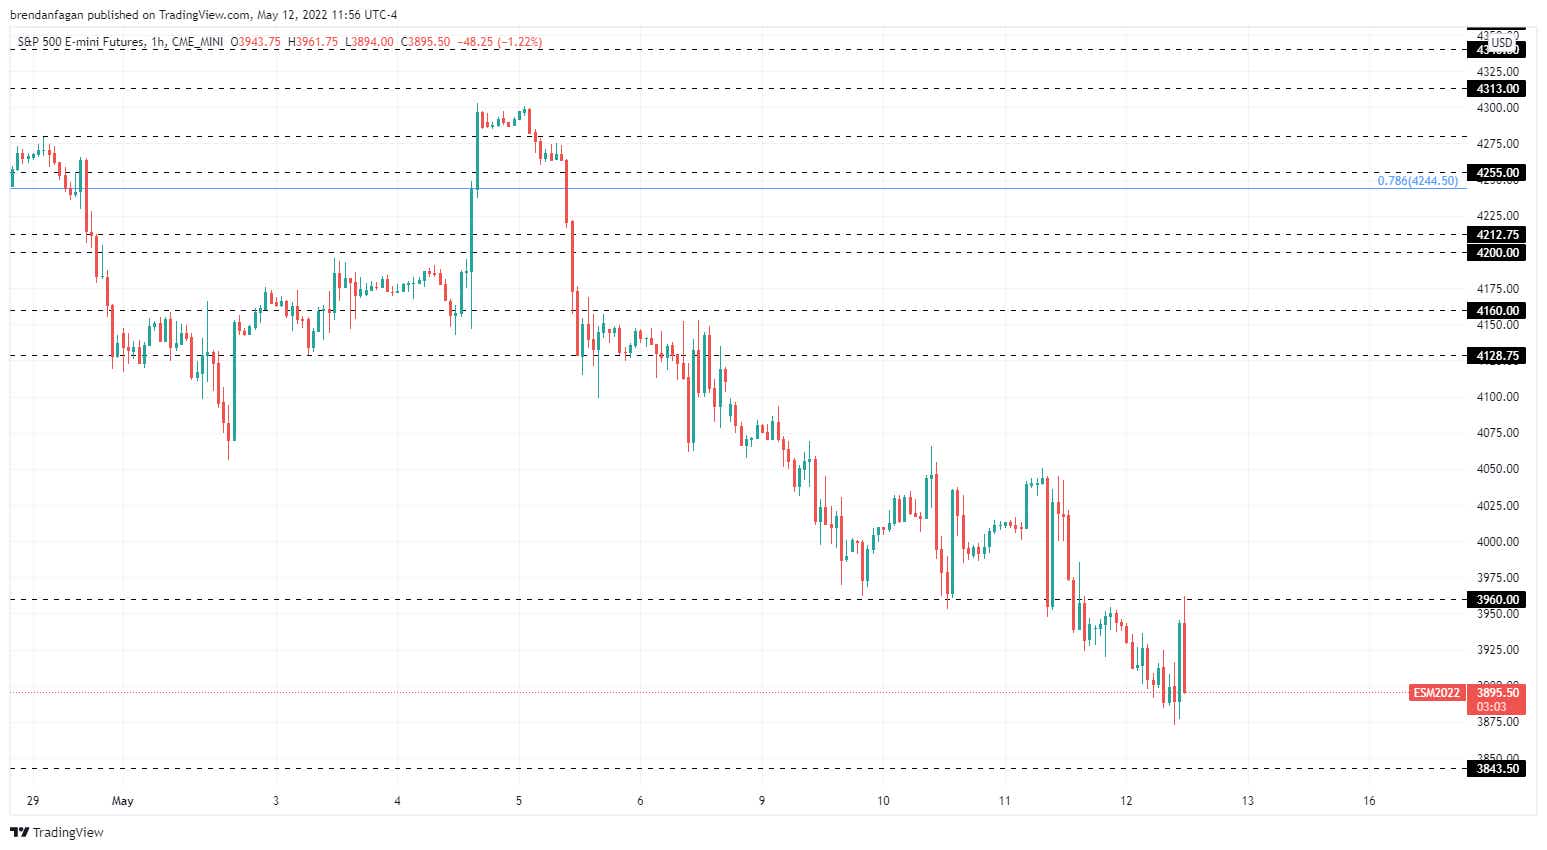
Chart created with TradingView
Options involve risk and are not suitable for all investors. Please read Characteristics and Risks of Standardized Options before deciding to invest in options.