Nasdaq 100 Reaches All-Time High, S&P 500 Next?

Nasdaq 100 Reaches All-Time High, S&P 500 Next?
After the December FOMC meeting, stock markets extended their gains
- U.S. stock markets are working on their seventh straight week of games.
- Each of the S&P 500 (/ESH4), Russell 2000 (/RTYH4), Nasdaq 100 (/NQH4), and Dow Jones 30 (/YMH4) established fresh yearly highs today; the latter two hit new all-time highs.
- The Russell 2000 (/RTYH4) is the best-performing major index in December, now up over 10%.

The first half of December is typically sluggish for stocks, but December 2023 has taken a very different tone.
Each of the four major U.S. equity indexes are up at least 3% month-to-date, while the Russell 2000 (/RTYH4) is up by more than 10% through the first two weeks of December.
Spurred on by Fed Chair Jerome Powell after the December Federal Open Market Committee (FOMC) meeting, stock markets have extended their gains to fresh yearly highs in most cases, and fresh all-time highs in the Nasdaq 100 (/NQH4) and the Dow Jones 30 (/YMH4).
While this isn’t necessarily a surprise for us—we’ve noted how bullish technical patterns remained intact earlier this month after observing a push to the yearly highs was possible weeks ago—the question must be asked: what’s next?
/ES S&P 500 price technical analysis: daily chart (September 2022 to December 2023)

The S&P 500 (/ESH4) traded to fresh yearly highs yesterday, eclipsing levels last seen in July. Momentum remains bullish amid an acceleration in gains in recent days. /ESH4 is still above its daily 5-, 13-, and 21-day exponential moving average (EMA) envelope, which remains in bullish sequential order. Slow stochastics are holding in overbought territory.
Moving average convergence divergence (MACD) is holding well-above its signal line. Now through the July high of 4738.50 (or 4685.25 in /ESZ3), the all-time high at 4808.50 is the next upside target. A close below the daily 5-EMA (one-week moving average) would warrant a reconsideration of this view.
/NQ Nasdaq 100 price technical analysis: daily chart (December 2022 to December 2023)
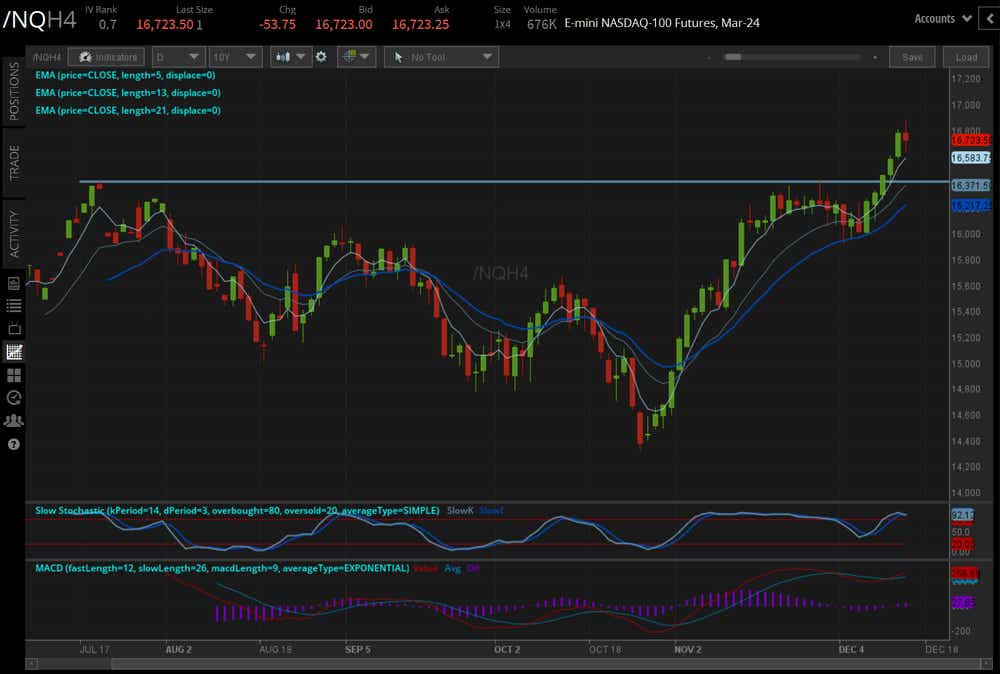
Last week it was noted, like it has been for the past month, that “the bullish falling wedge is the primary technical interpretation for the foreseeable future, targeting a return to the yearly high at 16264.25.” The Nasdaq 100 (/NQH4) achieved and cleared its yearly high, pushing to a fresh all-time high in the process.
Now that the bullish falling wedge has been fulfilled, /NQH4 is a pure bullish momentum play in the short-term. /NQH4 is back above its daily EMA envelope, which is still in bullish sequential order. Slow stochastics remain in overbought territory, and MACD is rising while above its signal line. Like in /ESH4, the view remains valid until a close below the daily 5-EMA (one-week moving average).
/RTY Russell 2000 price technical analysis: daily chart (April to December 2023)
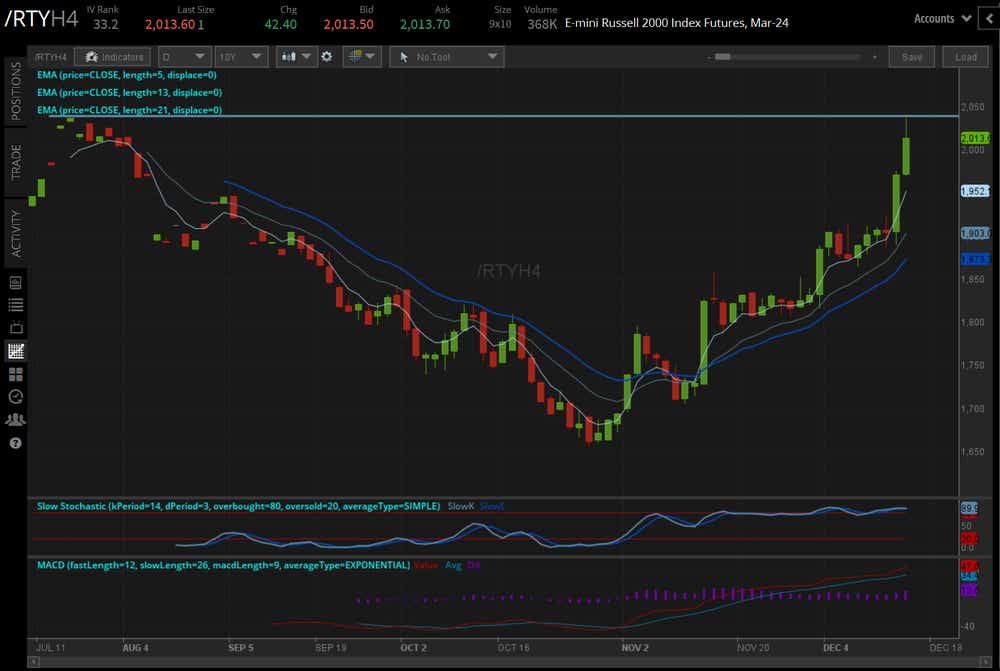
The Russell 2000 (/RTYH4) has been on an absolute tear the past two days, racking up gains nearing +7% from its lows pre-FOMC.
Establishing a fresh yearly high in the process, /RTYH4 has now encountered significant resistance, range highs dating back to August 2022.
What happens next is open to interpretation, but it appears that a multi-year sideways consolidation between 1635 and 2035 has been carved out; a move through multi-year resistance would suggest that a measured move, transpiring over multiple months or even more than a year, would begin towards 2435.
As good as late-2023 has been for /RTYH4, 2024 may be even better.
Christopher Vecchio, CFA, tastylive’s head of futures and forex, has been trading for nearly 20 years. He has consulted with multinational firms on FX hedging and lectured at Duke Law School on FX derivatives. Vecchio searches for high-convexity opportunities at the crossroads of macroeconomics and global politics. He hosts Futures Power Hour Monday-Friday and Let Me Explain on Tuesdays, and co-hosts Overtime, Monday-Thursday. @cvecchiofx
For live daily programming, market news and commentary, visit tastylive or the YouTube channels tastylive (for options traders), and tastyliveTrending for stocks, futures, forex & macro.
Trade with a better broker, open a tastytrade account today. tastylive, Inc. and tastytrade, Inc. are separate but affiliated companies.
Options involve risk and are not suitable for all investors. Please read Characteristics and Risks of Standardized Options before deciding to invest in options.