Russell 2000 Surges, Yields Drop as Powell Signals Victory

Russell 2000 Surges, Yields Drop as Powell Signals Victory
Fed Chair Jerome Powell’s remarks were the strongest indications yet that the rate hike cycle is over by saying policy is “sufficiently restrictive.”
- Fed Chair Jerome Powell’s remarks were the strongest indications yet that the rate hike cycle is over by saying policy is “sufficiently restrictive.”
- Fed funds futures are now discounting greater than a 65% chance of a 25-bps rate cut in March 2024.
- Bonds across the curve and stocks were near their highs for the week at the time this note was written.
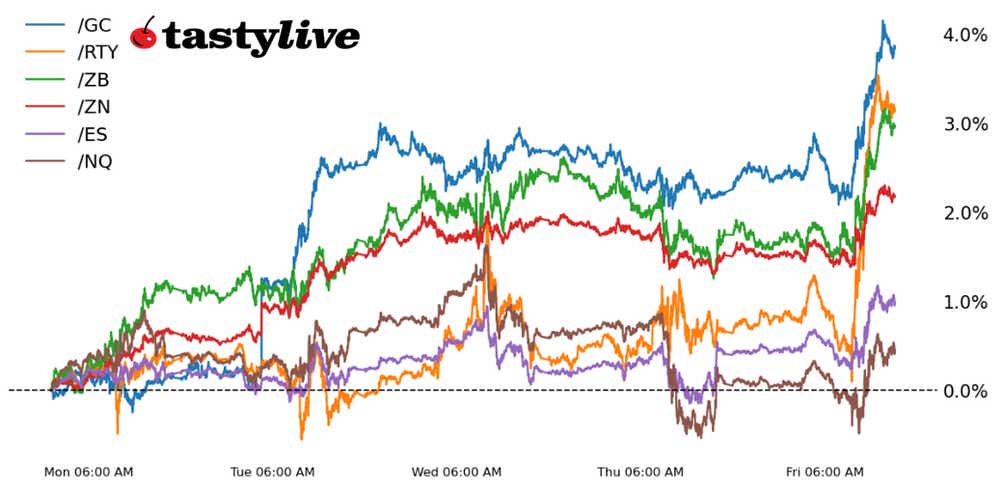
A November to remember has given way to a solid if not strong start to December for both stocks and bonds.
Led higher by the Russell 2000 (/RTYZ3), which has gained 2.83% today alone, all four major U.S. equity indexes are trading in positive territory on the day. Bonds are higher across the curve as well, led by the long end of the curve including 30-year T-bond futures (/ZBZ3) and ultra bonds (/UBZ3), which are Treasury bonds with at least 25 years to maturity. Those trends helped spark a move in gold prices (/GCG4) to their highest levels since May.
Dovish commentary from Powell
The spark came shortly after 11 a.m. Eastern Time, when Fed Chair Jerome Powell issued his most dovish commentary since perhaps 2021. While noting that it was “premature” to discuss rate cuts, the Fed Chair commented that policy was “sufficiently restrictive,” perhaps the clearest sign yet that the Fed rate hike cycle is done and dusted. Granted, bonds markets have been pricing in the end of the rate hike cycle for weeks; as if often the cases, markets lead policymakers.
/ZQ fed funds futures forward curve (December 2023 to December 2025)
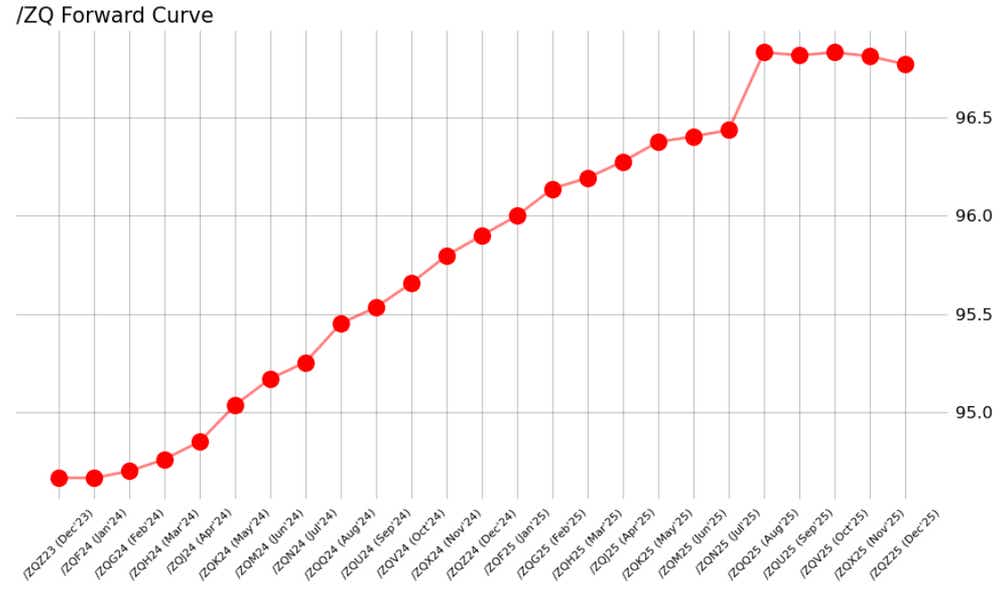
The /ZQ (fed funds) term structure responded in turn, continuing to zero out rate hike odds for both the December 2023 and January 2024 FOMC meetings. The action is really a few months out still, where a 25-bps rate cut is discounted by 91%, while a 25-bps rate cut is now priced-in to the tune of 67%. Historically, this is right on the nose: there is an average of eight months between the end of the rate hike cycle and the start of the rate cut cycle, and March 2024 is exactly eight months after the final rate hike in July 2023.
/RTY Russell 2000 price technical analysis: daily chart (April to December 2023)
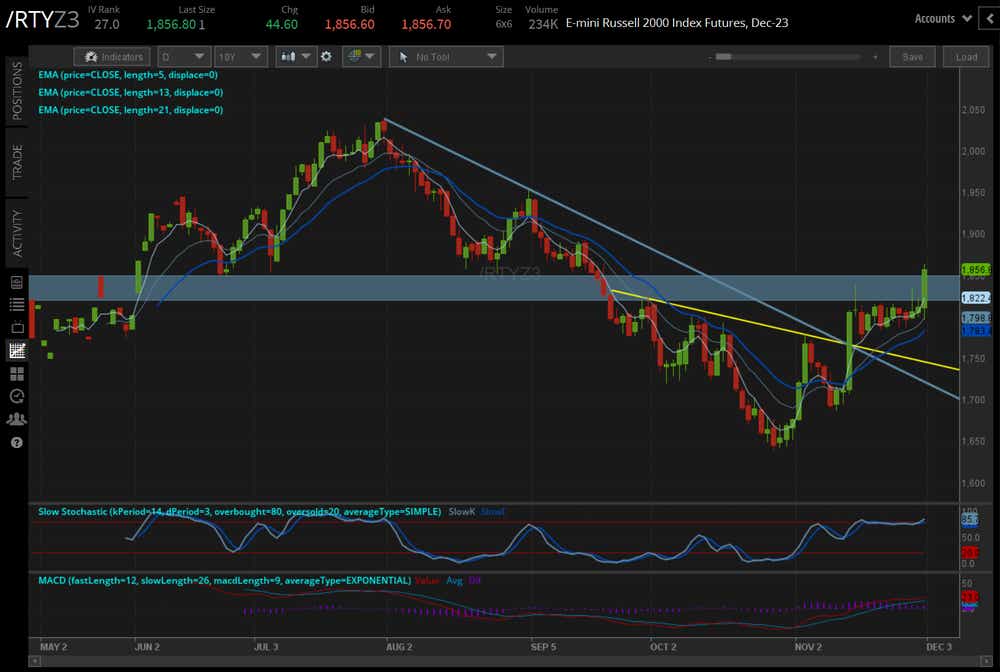
The shifting Fed rate cut odds proved to be a boon for the small cap-heavy Russell 2000 (/RTYZ3), which is having its best day since the release of the October U.S. inflation report on Nov. 14. /RTYZ3 continues to make progress after breaking out of the downtrend from the August and September swing high as well as an inverse head and shoulders pattern we’ve observed for the past few weeks.
Moreover, the index is close to scaling the critical zone around 1820/1850 (which has been both support and resistance since the regional banking crisis in March). The momentum profile is uniformly positive, from the bullish sequential nature of the daily EMA envelope to MACD and Slow Stochastics. While the inverse head and shoulders pattern may soon be completed (depending upon your measurement: at either 1867 or 1920), there is little technical resistance standing in the way of further gains in the near-term.
/10Y U.S. 10-year note yield technical analysis: daily chart (May to December 2023)
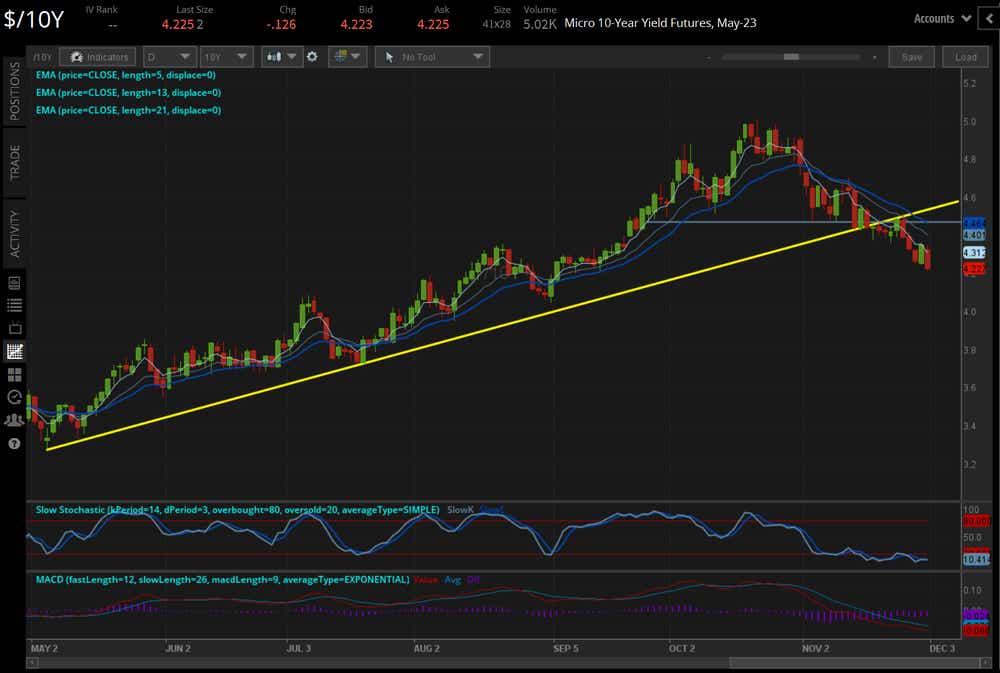
Boosting the momentum in U.S. equity markets has been the continued drop in U.S. Treasury yields, a trend that began over a month ago. It remains the case that the uptrend in the /10Y from the May, July, and September swing lows has been broken, and the /10Y is making further progress within the context of a head and shoulders topping pattern with a measured move towards 3.931%.
Christopher Vecchio, CFA, tastylive’s head of futures and forex, has been trading for nearly 20 years. He has consulted with multinational firms on FX hedging and lectured at Duke Law School on FX derivatives. Vecchio searches for high-convexity opportunities at the crossroads of macroeconomics and global politics. He hosts Futures Power Hour Monday-Friday and Let Me Explain on Tuesdays, and co-hosts Overtime, Monday-Thursday. @cvecchiofx
For live daily programming, market news and commentary, visit tastylive or the YouTube channels tastylive (for options traders), and tastyliveTrending for stocks, futures, forex & macro.
Trade with a better broker, open a tastytrade account today. tastylive, Inc. and tastytrade, Inc. are separate but affiliated companies.
Options involve risk and are not suitable for all investors. Please read Characteristics and Risks of Standardized Options before deciding to invest in options.