Implied vs. Realized Volatility

Implied vs. Realized Volatility
Going by absolute levels in the VIX, it's easy to look back at 2017 as a year of record-breaking futility. After all, the VIX never even broke 19, which had been the approximate average in the metric over the past decade.
However, there's another element of the analysis that needs to be considered, as noted on a recent episode of Ryan & Beef.
Implied volatility represents the current market price for volatility, or the fair value of volatility based on the market's expectation for movement over a defined period of time.
Realized volatility, on the other hand, is the actual movement that occurs in a given underlying over a defined past period. For the VIX, that underlying is the S&P 500.
Volatility traders obviously care not only about what is expected but also what actually transpired.
Looking at data from 2004 to present, a snapshot of both implied and realized volatility over that period helps reframe 2017 in new perspective.
As you can see below, while 2017 implied volatility was certainly lower than usual, the relationship between implied and realized volatility remained fairly "normal":
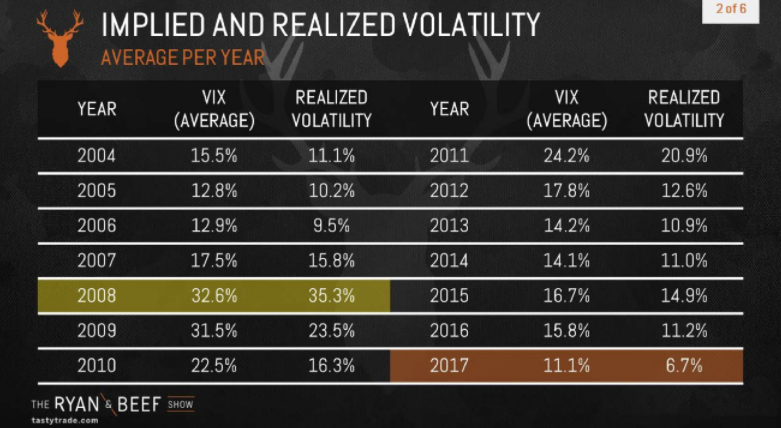
Per the above graphic, the average VIX in 2017 was lower than any of the other years included in the analysis. However, realized volatility also dipped to its lowest level as compared to the other thirteen years examined.
This information begs the next question. How does the difference between implied volatility and realized volatility in 2017 compare to other years?
The chart below shows the difference between implied volatility and realized volatility by year (2004 to present):
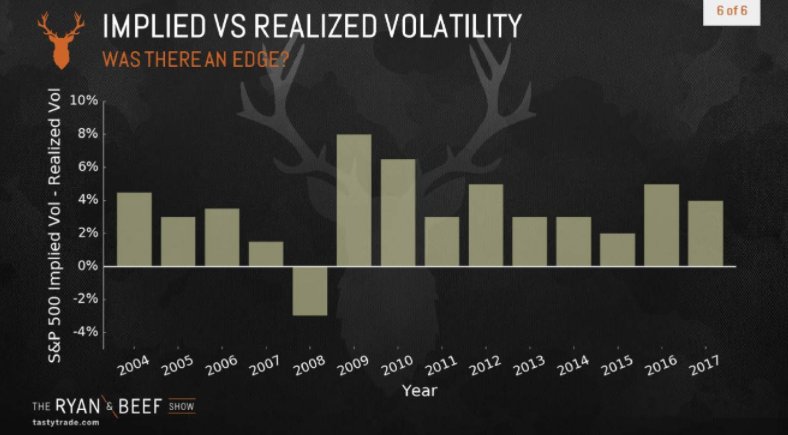
According to the chart above, 2017 was much closer to an "average" year when it comes to the difference between implied volatility and realized volatility. From this perspective, the true outlying year in history is 2008, when realized volatility was actually higher than implied volatility - the only such instance over the period examined.
This episode of Ryan & Beef serves as an important reminder that absolute levels of implied volatility only tell half the story. That’s a big reason we use metrics such as Implied Volatility Rank (IVR) to assist with trading decisions.
So while implied volatility may have been anemic in 2017, the ultimate potential for opportunity (i.e. the difference between implied volatility and realized volatility) was much closer to “normal.”
We hope you’ll take the time to review the complete episode of Ryan & Beef when your schedule allows.
If you have any questions or comments on this material, don’t hesitate to contact us by leaving a message in the space below or sending an email to support@tastylive.com.
We look forward to hearing from you!
Sage Anderson has an extensive background trading equity derivatives and managing volatility-based portfolios. He has traded hundreds of thousands of contracts across the spectrum of industries in the single-stock universe.
Options involve risk and are not suitable for all investors. Please read Characteristics and Risks of Standardized Options before deciding to invest in options.