Technical Analysis 101: How to Read Candlesticks

Technical Analysis 101: How to Read Candlesticks
Candlestick analysis helps readers place trades or adjust exposure in the market
One of the many tools traders have at their disposal is candlestick analysis. Invented centuries ago to track Japanese rice prices, candlestick analysis was popularized in the 1990s after Steve Nison released the book Japanese Candlestick Charting Techniques.
Traders can use candlestick analysis to understand market trends and sentiment, helping to guide decision making when placing trades or adjusting exposure in the market.
What is a candlestick?
A candlestick is a single bar for a specific timeframe (hourly, daily, weekly, etc.) consisting of three potential sections: the body, which is the difference between the open and the close; the upper wick, which indicates how high prices have moved during the period; and the lower wick, which indicates how low prices have moved during the period.
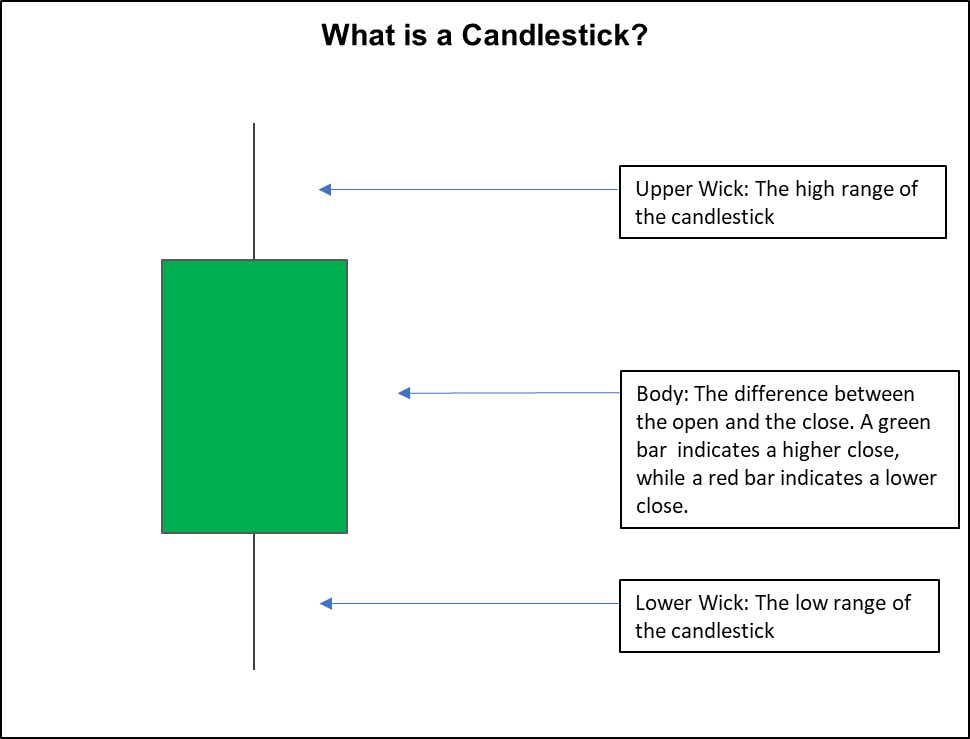
Candlesticks tell a story about how price action unfolded during the reference timeframe. Groups of candlesticks can offer insight into shifts in sentiment and directionality in markets, which can help assist with scaling risk management around new or existing positions.
In this article, we’ll review five candlestick patterns that technical traders can use to identify opportunities in markets.
Doji
A doji candlestick has a “T” shape that signifies the same opening and closing price of an asset, resulting in a negligible or absent body and symmetrical upper and lower shadows. The doji generally reflects market uncertainty but may also signal a weakening of the prevailing trend.

For example, a doji in an upward trend may indicate a decline in buying pressure or an increase in selling pressure. Traders may interpret this as an opportunity to close their existing position.
Bullish Engulfing and Bearish Engulfing

Engulfing candles indicate either potential trend reversal in the market (e.g. a bullish engulfing bar, or bullish key reversal, at a low) or a strengthening of a trend (e.g. a bullish engulfing bar during an uptrend). This pattern consists of two candles with the second completely covering the body of the previous candle.

The engulfing candle can be either bullish or bearish, depending on its position in the current trend. A bullish engulfing candle pattern consists of two candles with the second fully covering the body of the preceding red/down candle. A bearish engulfing candle pattern has two candles with the second candle eclipsing the body of the preceding green/up candle.
Morning Star and Evening Star
The morning star pattern consists of three candles that signal a bullish reversal at the end of a downtrend. It shows a decrease in downward pressure before a significant bullish move initiates a new uptrend.

The evening star pattern consists of three candles that signal a bearish reversal at the end of an uptrend. It shows a decrease in upward pressure before a significant bearish move initiates a new downtrend.

Inside Day or Inside Bar
Inside days or inside bars happen when candlestick patterns on a specific timeframe are bounded by the previous session’s high and low. The inside bar shows a narrower trading range than the previous session.
Often indicating some consolidation, a sequence of inside days can signal a forthcoming trend reversal. The inside bar is the opposite of the engulfing candlestick. The inside bar fits completely within the previous bar: it cannot trade above the previous bar’s high or low.

Hammer and Shooting Star
A hammer has a bullish implication with a long lower wick, negligible or absent upper wick and a limited body near the day’s high. It follows a downtrend and may signal a trend reversal to the upside. The gap between the low and opening price of the candle must exceed twice the size of the hammer’s body. The gap between the highest price for the day and the closing price must be very small or missing.

A shooting star has a bearish implication with a long upper wick, negligible or absent lower wick and a limited body near the day’s low. It follows an uptrend and may signal a trend reversal to the downside. The gap between the high and opening price of the candle must exceed twice the size of the shooting star’s body.
The gap between the lowest price for the day and the closing price must be very small or missing.

Christopher Vecchio, CFA, tastylive’s head of futures and forex, has been trading for nearly 20 years. He has consulted with multinational firms on FX hedging and lectured at Duke Law School on FX derivatives. Vecchio searches for high-convexity opportunities at the crossroads of macroeconomics and global politics. He hosts Futures Power Hour Monday-Friday and Let Me Explain on Tuesdays, and co-hosts Overtime, Monday-Thursday. @cvecchiofx
For live daily programming, market news and commentary, visit tastylive or the YouTube channels tastylive (for options traders), and tastyliveTrending for stocks, futures, forex & macro.
Trade with a better broker, open a tastytrade account today. tastylive, Inc. and tastytrade, Inc. are separate but affiliated companies.
Options involve risk and are not suitable for all investors. Please read Characteristics and Risks of Standardized Options before deciding to invest in options.