How Does Dollar Cost Averaging Actually Work?

How Does Dollar Cost Averaging Actually Work?
By:Tom Preston
You can't know when the market is at its lowest. So, building a position gradually can be helpful.
Everybody's heard of dollar cost averaging. But how does it work?
And why does it work?
Here's a breakdown of the key factors.
Dollar cost averaging is a popular investment technique that’s been around for a long time. Maybe that’s why it’s one of the first things new investors learn about.
But before you decide to incorporate it into your stock or mutual fund strategy, you should learn about not just how it works, but why it works—and when it doesn’t.
At its simplest, dollar cost averaging is a series of partial investments over time. For example, if an investor has $10,000 that she wants to put into an S&P 500 fund, she could simply put all the money into the fund right now. But she watches the market and sees that the S&P 500 moves up and down. Wouldn’t it be better to buy the S&P 500 when it’s lower? Sure! But when is that going to happen? She doesn’t know—and can’t know—that.
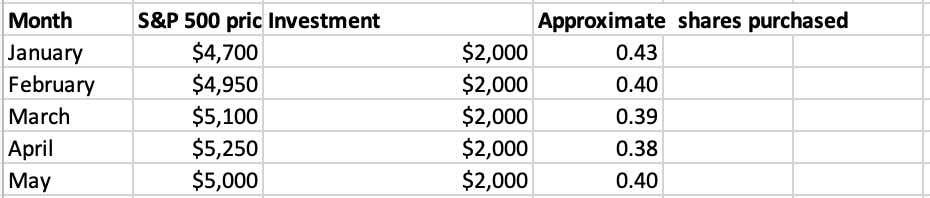
So, she puts $2,000 into the fund now, and every month until she’s invested her full $10,000. It might look something like this.
(Note: Total investment: $2,250; Total shares: 22.04.)
No guarantee of profits
Because the investment amounts are all the same ($2,000), the average price of the S&P 500 fund she invested in is simply the numerical average of the S&P 500 prices. That’s $5,000.
Two of her investments were below that average (January and February), two were above (March and April) and one was at the average (May).
If the S&P 500 is at $5,200 in June 2024, her investment would have a profit of about $400 before any commissions and fees. That’s calculated by adding up all the shares she purchased (2), multiplying that by the current price of the S&P 500 ($5,200), and subtracting her total investment ($10,000).
That’s less profit than she would have earned if she invested all $10,000 in January. If she’d done that, she’d have about $1,063 profit before commissions and fees. And dollar cost averaging gives her more profit if she waited and invested all $10,000 in April. If she’d done that, she’d have lost about $95.
So, dollar cost averaging is no guarantee of investment profits. That’s particularly true when the market is falling or flat. For example, if the S&P 500 had been falling when the investor began dollar cost averaging, it would have resulted in a loss.
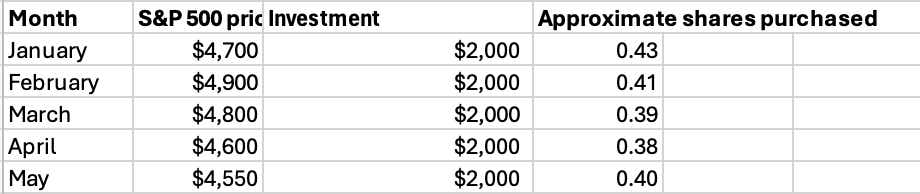
If the S&P 500 is at $4,500 in June, dollar cost averaging still has a loss of about $415 before commissions and fees. When the market’s falling, dollar cost averaging could make your loss smaller because you’re buying at lower and lower prices rather than a single, higher price. Nevertheless, dollar cost averaging can still lose money in a bear market.
Timing the market
Considering all this, dollar cost averaging is at its heart a type of market timing. It can be profitable when the market is going up over time, and when it moves up more than it falls. As its name implies, dollar cost averaging tries to take advantage of that up-and-down market behavior and give the investor an “average” price that is neither the lowest price nor the highest price over the long-term.
Dollar cost averaging can be used in mutual funds, stocks, and even ETFs. But it isn’t used in option trading because the price behavior of options is more complex than funds or stocks, and option trading is typically shorter-term than long-term investments.
Finally, the calculation of the average price of a dollar cost averaging strategy is straightforward. Whether a person makes investments by dollar amounts (e.g. $500 per month) or shares (e.g. 10 shares per month), the goal is to find the average price at which she bought the shares.
The average price is a weighted average of the prices of the individual transactions times the number of shares purchased at the price. Consider an example of different-size dollar investments over five months at different prices of a mutual fund.
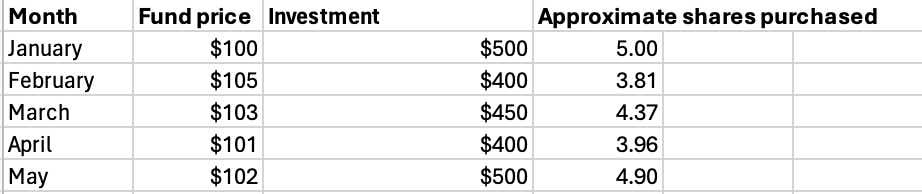
The dollar cost average share price is the total investment ($2,250) divided by the total number of shares (22.04). $2,250 / 22.04 = $102.09. An investor can compare this average price to the current price of the fund and have an idea of whether the overall strategy might be profitable or not.
Tom Preston, tastylive chief market strategist, is responsible for the brokerage’s trading strategy, client-facing trading software and futures trading products. He contributes to Luckbox magazine and writes tastylive's Cherry Bomb newsletter. He's been trading options since 1992.
For live daily programming, market news and commentary, visit tastylive or the YouTube channels tastylive (for options traders), and tastyliveTrending for stocks, futures, forex & macro.
Trade with a better broker, open a tastytrade account today. tastylive, Inc. and tastytrade, Inc. are separate but affiliated companies.
Options involve risk and are not suitable for all investors. Please read Characteristics and Risks of Standardized Options before deciding to invest in options.