From Price to Volatility: A Deep Dive into IV Correlation

From Price to Volatility: A Deep Dive into IV Correlation
By:Kai Zeng
Diversifying options strategies in a low IV market becomes crucial to reducing IV expansion risk
When we talk about diversification in investing, our main aim is to reduce the risk of price changes by selecting assets that don’t move in the same direction.
For instance, a portfolio that includes U.S. Treasury bonds (TLT) and Lululemon Athletica (LULU) is more diversified and therefore carries lower risk than a portfolio containing the SPDR S&P 500 ETF (SPY) and the Invesco QQQ Trust (QQQ). This is because the connection between Lululemon (LULU) and United States Oil Fund (USO) is weak, with a correlation of only 0.25, whereas SPY and QQQ have a very strong correlation of 0.85 or higher.
We examined how asset price correlations change over time using two groups:
Low-correlation assets: U.S. Treasury bonds (TLT), SPDR gold shares (GLD), United States Natural Gas Fund (UNG) and United States Oil Fund (USO)
High-correlation assets: SPDR S&P 500 ETF (SPY), Invesco QQQ Trust (QQQ), SPDR Dow Jones Industrial Average ETF (DIA)
We analyzed three-month and five-year periods for these assets.
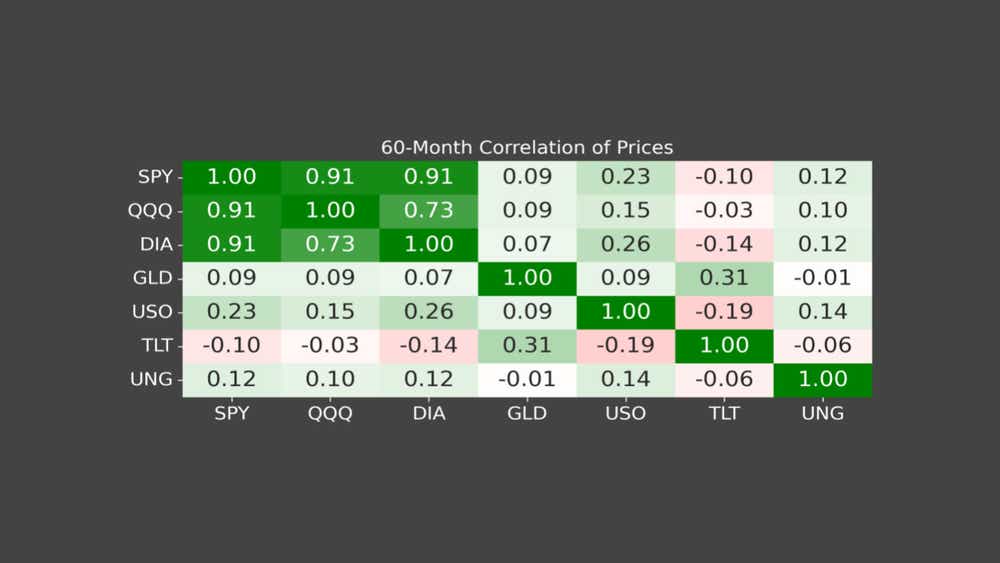
The five-year data revealed a significant difference between highly correlated and weakly correlated assets. The indices ETFs (SPY, QQQ, DIA) have high correlations, typically between 0.75 and 1. In contrast, the low-correlation assets have correlations ranging from -0.25 to 0.25. This outcome is in line with our expectations.

We found a similar pattern with more recent readings in 2024. Although TLT has shown a positive correlation with SPY lately, in general, the weakly correlated assets have maintained a relatively low correlation.
.png?format=pjpg&auto=webp&quality=50&width=1000&disable=upscale)
In options trading, changes in implied volatility (IV) affect options prices, which in turn impacts profit and loss. We assessed the IV correlations of the same asset groups over the same time frames.
The gap in IV correlations between low and high-correlation assets is less noticeable compared to their price correlations. The low-correlation group shows moderate IV correlations around 0.50.
.png?format=pjpg&auto=webp&quality=50&width=1000&disable=upscale)
However, in the short term, the low-correlation assets display much lower IV correlations, primarily because the market is at a peak, resulting in extremely low IVs.
.png?format=pjpg&auto=webp&quality=50&width=1000&disable=upscale)
These findings highlight crucial takeaways for active investors. The correlation between assets' implied volatility is more sensitive to market conditions than the correlation between their underlying prices. A well-diversified portfolio with low IV correlations can be misleading during periods of market complacency. Therefore, for premium sellers, diversifying options strategies in a low IV market becomes crucial to reducing IV expansion risk. Understanding these dynamics helps traders to craft more resilient and balanced trading strategies.
Kai Zeng, director of the research team and head of Chinese content at tastylive, has 20 years of experience in markets and derivatives trading. He cohosts several live shows, including From Theory to Practice and Building Blocks. @kai_zeng1
For live daily programming, market news and commentary, visit tastylive or the YouTube channels tastylive (for options traders), and tastyliveTrending for stocks, futures, forex & macro.
Trade with a better broker, open a tastytrade account today. tastylive, Inc. and tastytrade, Inc. are separate but affiliated companies.
Options involve risk and are not suitable for all investors. Please read Characteristics and Risks of Standardized Options before deciding to invest in options.