Energy Stocks’ Power Surge Continues

Energy Stocks’ Power Surge Continues
XLE up 3.22% week-to-date
- Gains in crude oil prices (/CL) this week propelled energy stocks and ETFs to fresh multi-month highs
- It may not be long before U.S. equity markets take issue with a breakout higher by crude oil prices, however.
- If crude oil price gains become problematic, it leaves XLE, XOP, and CRAK well-positioned to outperform their peers.
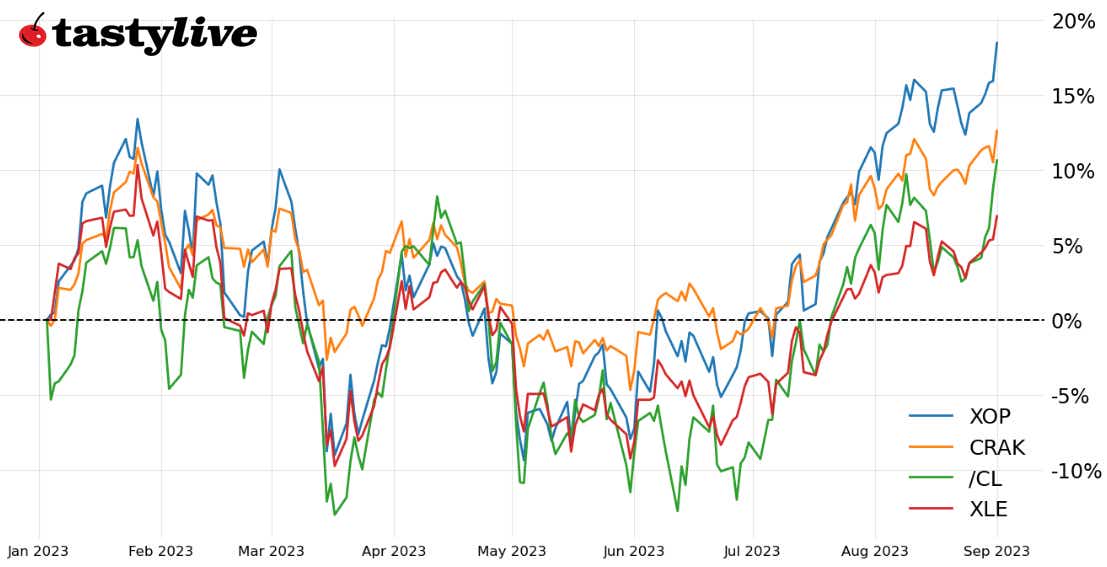
In a week when U.S. equity markets have performed well, one sector is standing out more than others into the close of trading ahead of Labor Day weekend: energy.
Crude oil prices (/CL) hit their highest levels November 2022, spurred on by shifting expectations on both sides of supply and demand. OPEC+ is likely to extend cuts; and renewed hopes over China’s stimulus efforts, coupled with a fairly goldilocks August U.S. jobs report, have demand looking firmer in the short term.
In mid-July, we suggested that “it may be time to be ‘an oil man’ again.” It’s look especially good to be an oil man moving forward, given the technical breakouts seen in /CLV3, XLE, XLF, and CRAK.
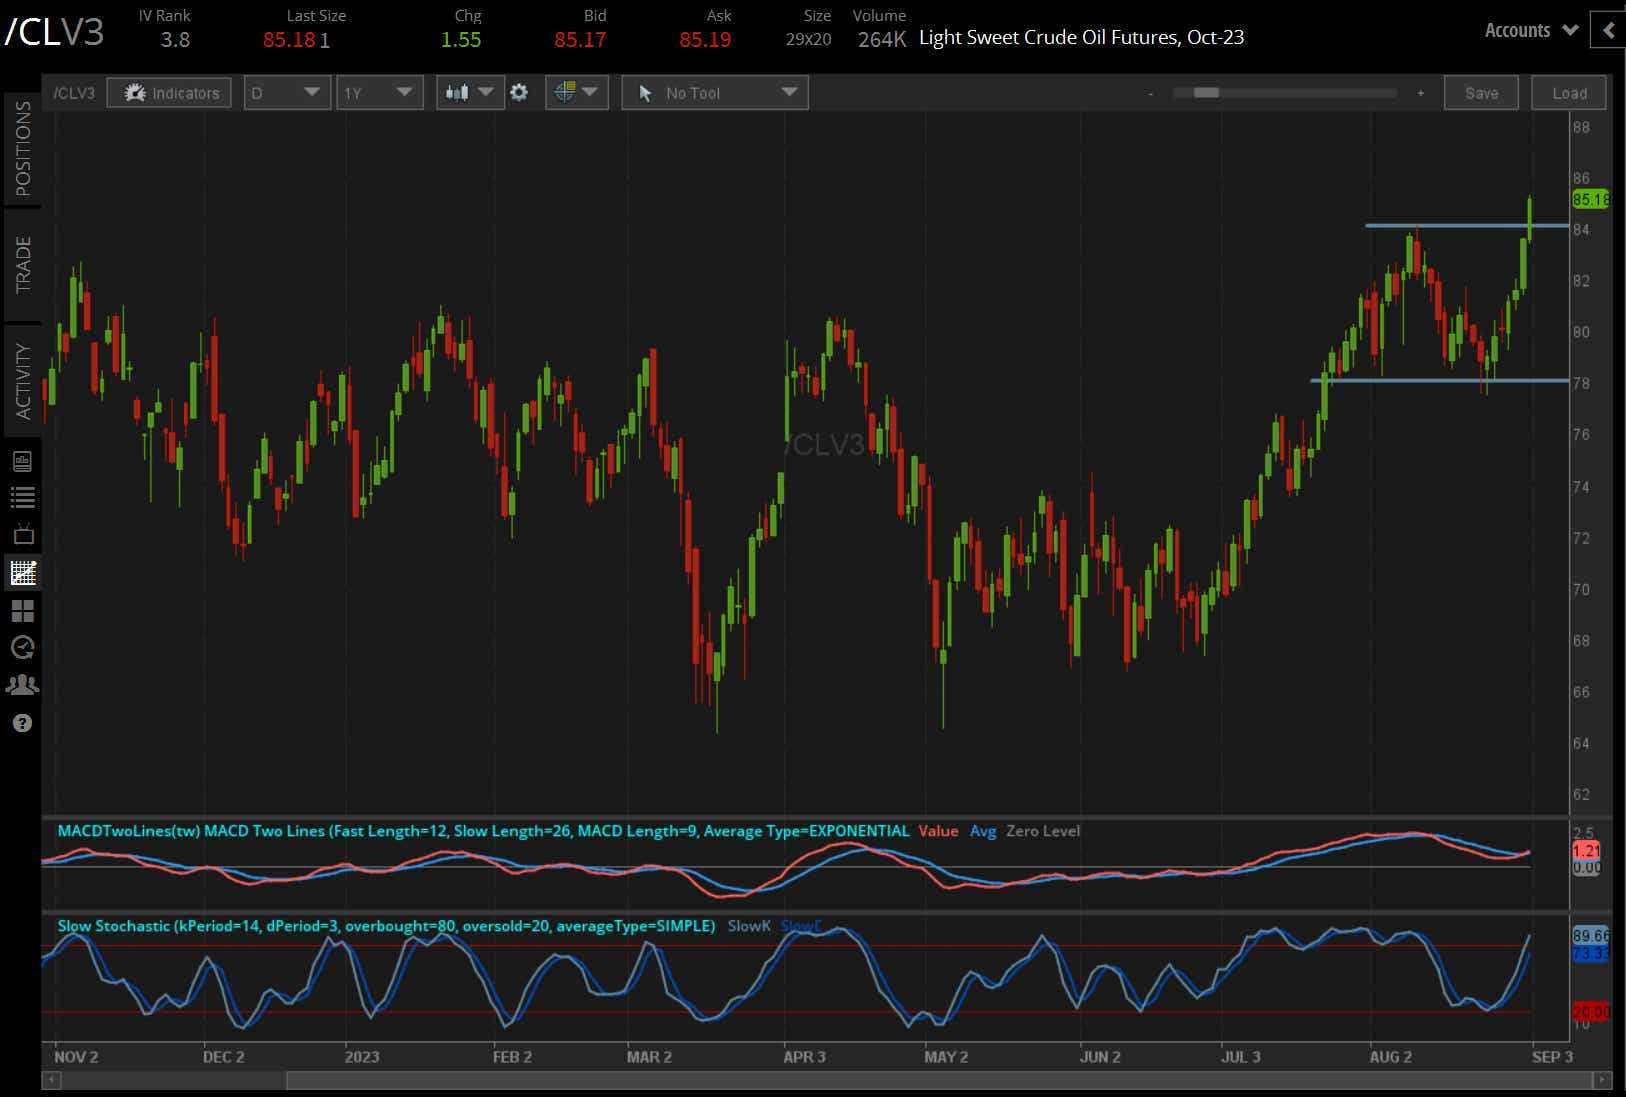
/CL price technical analysis: daily chart (October 2022 to September 2023)
/CLV3 may have been carving out a bull flag after the rally from the late-June lows, but the push to its highest level since November 2022 suggests that the bull flag breakout is in play. Momentum is firm, with /CLV3 above its daily 5-, 13-, and 21-EMA envelope which is in bullish sequential order. MACD has issued a bullish crossover while above its signal line and Slow Stochastics have reached overbought territory. The path of least resistance is to the upside, plain and simple.
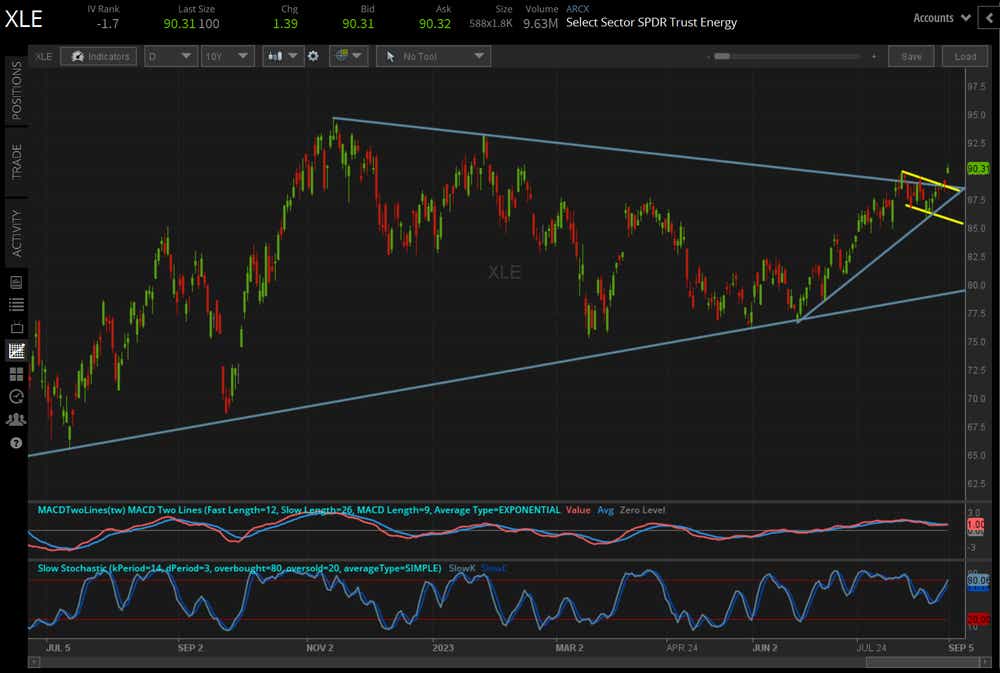
XLE Price Technical Analysis: Daily Chart (June 2022 to September 2023)
In mid-July, it was noted that “the start of July produced a breakout from the downtrend off of the January and April swing highs … a return to the April high at 87.74 is the next hurdle to clear.” XLE has traded through its April high, but carved out a bull flag throughout August as it consolidated near the downtrend from the November 2022 and January 2023 swing highs. The new bullish effort is greeted by a strong momentum structure, which points to a return to the November 2022 high at 94.71.
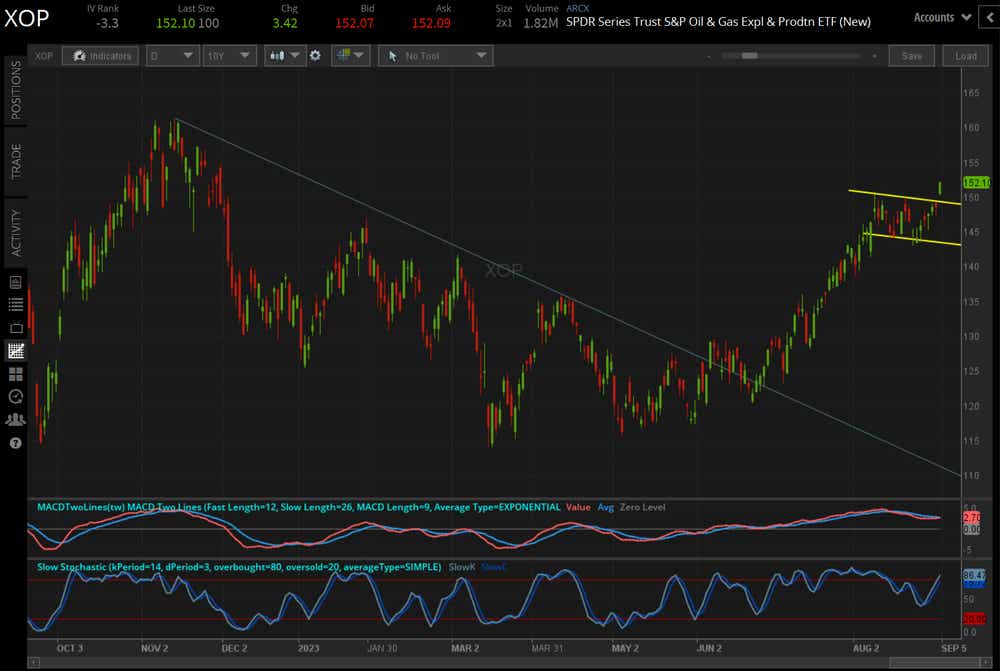
XOP price technical analysis: daily chart (November 2022 to January 2023)
XOP has a similar technical structure to XLE, but due to weighting differences between the two ETFs, XOP has had a more bullish technical setup in recent months. But XLE and XOP both consolidated into bull flags in August, with XOP breaking out to its highest level since December 2022. The momentum structure is a bullish flush (MACD, Slow Stochastics, and moving averages all in bullish order). Until momentum rolls over, the path of least resistance is for XOP to return to its November 2022 high at 161.42.
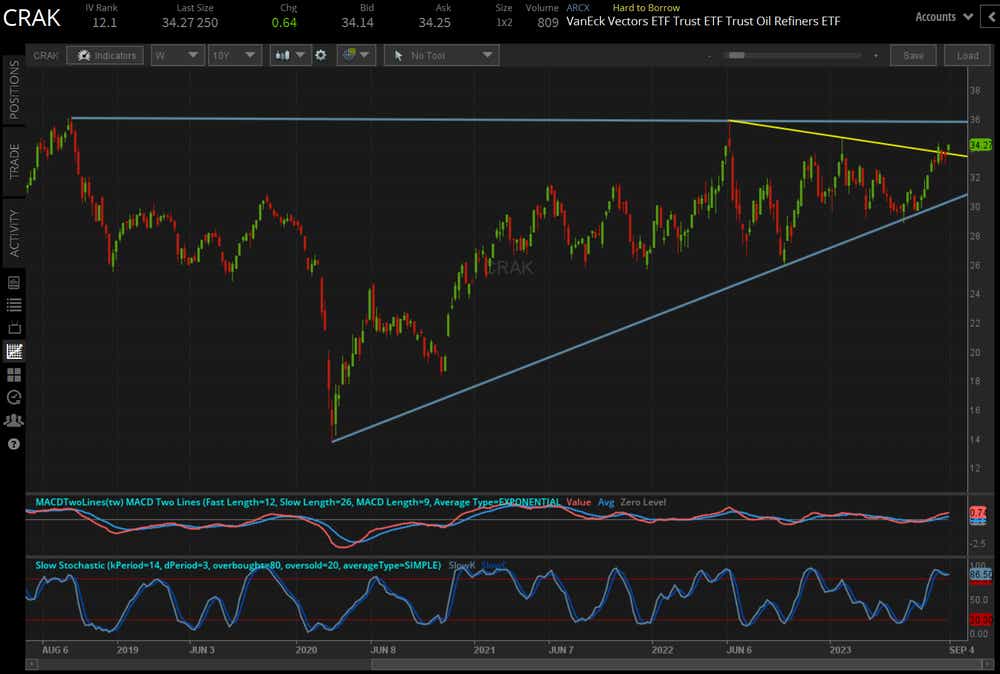
CRAK price technical analysis: daily chart (November 2022 to January 2023)
CRAK tracks refiners, not producers, like XLE and XOP. On the weekly chart, it’s clear that the symmetrical triangle that began in June 2022 is starting to give way, putting into focus the much longer-term ascending triangle that may have formed dating back to 2018. Previously, it was noted that “triangle resistance comes in closer to 33.75-34 over the coming weeks. Should CRAK overtake this zone before the end of August, a return to the all-time highs near 36 would become the key focal point through the remainder of 2023.” Indeed, all-time highs are in focus unless short-term momentum buckles.
Christopher Vecchio, CFA, tastylive’s head of futures and forex, has been trading for nearly 20 years. He has consulted with multinational firms on FX hedging and lectured at Duke Law School on FX derivatives. Vecchio searches for high-convexity opportunities at the crossroads of macroeconomics and global politics. He hosts Futures Power Hour Monday-Friday and Let Me Explain on Tuesdays, and co-hosts Overtime, Monday-Thursday. @cvecchiofx
For live daily programming, market news and commentary, visit tastylive or the YouTube channels tastylive (for options traders), and tastyliveTrending for stocks, futures, forex & macro.
Trade with a better broker, open a tastytrade account today. tastylive, Inc. and tastytrade, Inc. are separate but affiliated companies.
Options involve risk and are not suitable for all investors. Please read Characteristics and Risks of Standardized Options before deciding to invest in options.