Is an Inverted Yield Curve a Clear Indication of Recession?

Is an Inverted Yield Curve a Clear Indication of Recession?
By:Kai Zeng
In the past, an inverted yield curve has often signaled an upcoming downturn. How about now?
Typically, the interest rates on longer-term U.S. Treasury bonds (like those maturing in 10 years) are higher than those on shorter-term bonds (such as two-year bonds).
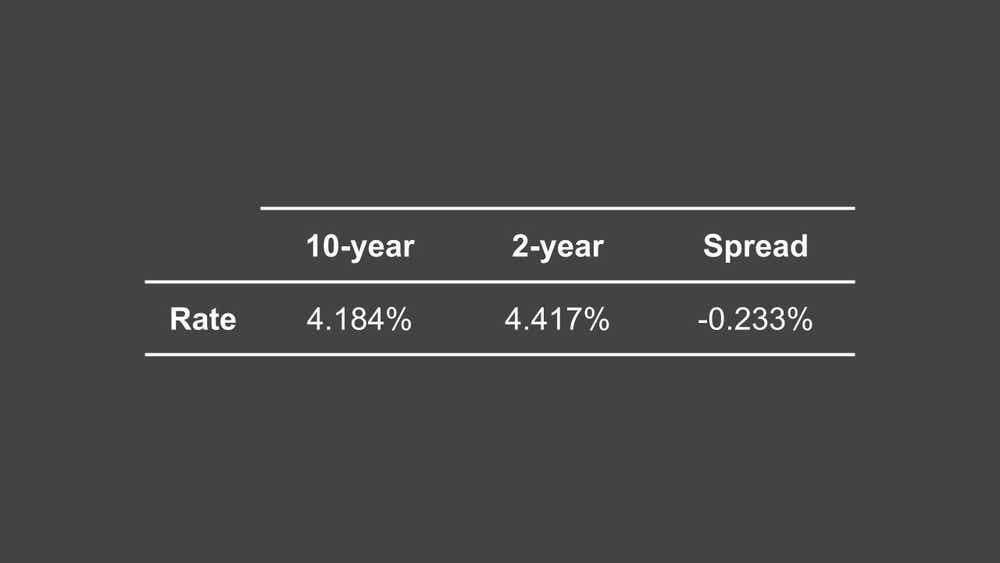
When this relationship flips, it’s called a Treasury yield curve inversion. One common way to measure this is by looking at the difference (or spread) between the 10-year and two-year Treasury bond yields. Right now, this spread is below zero.

Historically, an inverted yield curve is thought to signal a potential recession within the next 12 to 24 months. To explore this, we examined data including stock performance during and after periods of inverted yield curves since January 2000.
For example, in June 2023, the spread between the 10-year and 2-year Treasury yields dropped significantly. Considering the long-term average spread is about 1.05%, the current level is exceptionally low.
.jpg?format=pjpg&auto=webp&quality=50&width=1000&disable=upscale)
In the last 35 years, there have been only three instances when the yield curve inversion lasted more than a week. This current inversion has already extended beyond 24 months, making it the longest since 1990.
.jpg?format=pjpg&auto=webp&quality=50&width=1000&disable=upscale)
However, despite this prolonged inversion, we haven't seen a recession over the past two years. On the contrary, the market continued to reach new highs, challenging the reliability of this indicator.
To delve deeper, we examined how previous yield curve inversions affected the stock market, particularly during the inversion and one to two years afterward.
During the inversion period, market performance was inconsistent, showing movements in both directions. This suggests an inverted yield curve is not a strong predictor of market performance while the inversion is still ongoing.
.jpg?format=pjpg&auto=webp&quality=50&width=1000&disable=upscale)
Historically, while the market experienced negative returns a year after the first two recent inversions, the 2022 inversion saw positive returns across major indices like the S&P 500 ($SPX), Dow Jones ($DJI) and Nasdaq ($COMP).
.jpg?format=pjpg&auto=webp&quality=50&width=1000&disable=upscale)
Interestingly, all three instances showed positive market returns two years after the inversion.
.jpg?format=pjpg&auto=webp&quality=50&width=1000&disable=upscale)
In summary, there is no solid evidence to indicate that a yield curve inversion is a reliable forecast of an impending recession within the next 12 to 24 months.
Key takeaways:
Infrequent Events: Yield curve inversions are rare, with the long-term average spread between the 10-year and two-year Treasury bonds at 1.05%.
Current Inversion: The current inversion, lasting over two years, is the longest since 1990.
Market Impact: No strong correlation exists between an inverted yield curve and a market recession in the subsequent one or two years, making it a less reliable predictor.
Kai Zeng, director of the research team and head of Chinese content at tastylive, has 20 years of experience in markets and derivatives trading. He cohosts several live shows, including From Theory to Practice and Building Blocks. @kai_zeng1
For live daily programming, market news and commentary, visit tastylive or the YouTube channels tastylive (for options traders), and tastyliveTrending for stocks, futures, forex & macro.
Trade with a better broker, open a tastytrade account today. tastylive, Inc. and tastytrade, Inc. are separate but affiliated companies.
Options involve risk and are not suitable for all investors. Please read Characteristics and Risks of Standardized Options before deciding to invest in options.