Crude Oil Surge Bedevils Stocks and Bonds

Crude Oil Surge Bedevils Stocks and Bonds
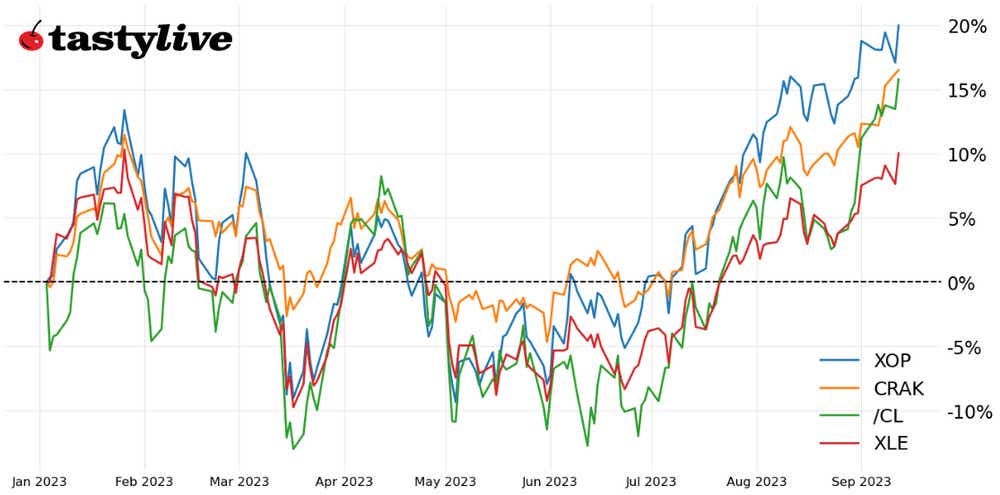
Crude oil is up 6.66% month-to-date
- Crude oil prices (/CL) have jumped to fresh yearly highs as supply/demand imbalances are expected to persist through the end of the year.
- Even as U.S. equity markets struggle, oil equities remain on the up-and-up.
- It remains the case that as crude oil price gains become problematic, XLE, XOP, and CRAK are well-positioned to outperform their peers.
Crude oil prices (/CL) remain on strong footing. With reports emerging that the OPEC+ production cuts will leave the global oil market undersupplied, relative to demand, by approximately three million barrels per day through the end of the year, black gold is shining once more.
Closing in on a 52-week high, crude oil prices are proving to be a veritable thorn in the side of most other asset classes. Now up by 6.66% month-to-date, one might say that oil is bedeviling markets as renewed inflation concerns produce sluggish price action in both stocks and bonds. Regardless, it remains the case that it’s a good time to be “an oil man.”
/CL price technical analysis: daily chart (February 2023 to September 2023)
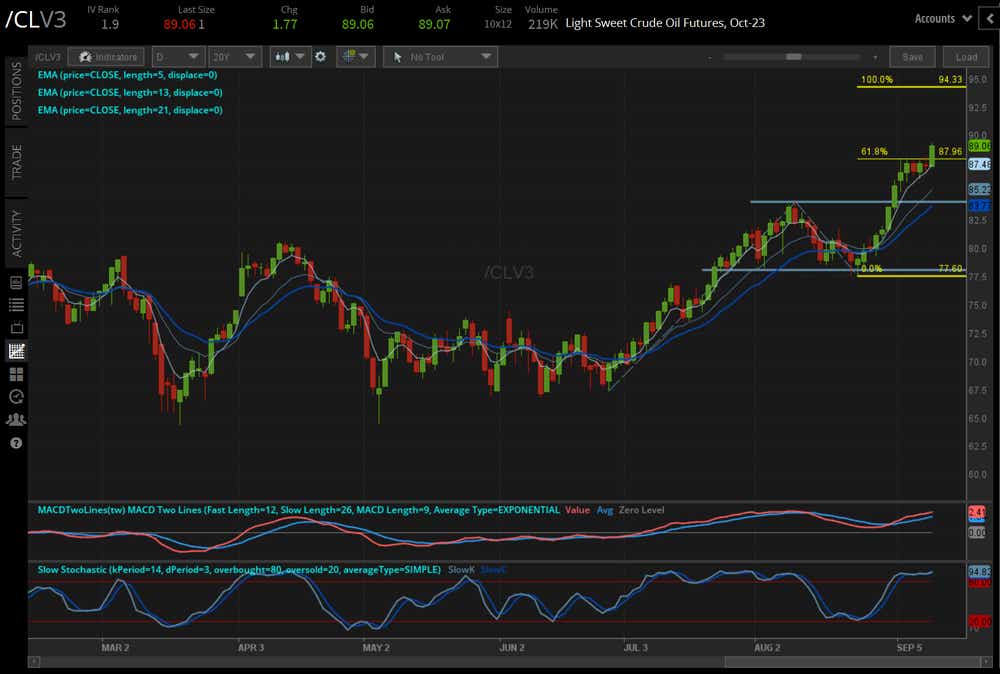
In our note in early September, we observed that “/CLV3 may have been carving out a bull flag after the rally from the late-June lows, but the push to its highest level since November 2022 suggests that the bull flag breakout is in play.” Having risen to the 61.8% Fibonacci extension of the move from the June 28 low/August 10 high/Aug. 24 low range, /CLV3 paused for a week before it began its next leg up today. With momentum bullish - /CLV3 is above its daily 5-, 13-, and 21-EMA envelope, which is in bullish sequential order; MACD is trending higher above its signal line; and slow stochastics are holding in overbought territory - the path of least resistance remains higher. The aforementioned Fibonacci extension suggests a terminal target of 94.33.
XLE Price Technical Analysis: Daily Chart (July 2022 to September 2023)
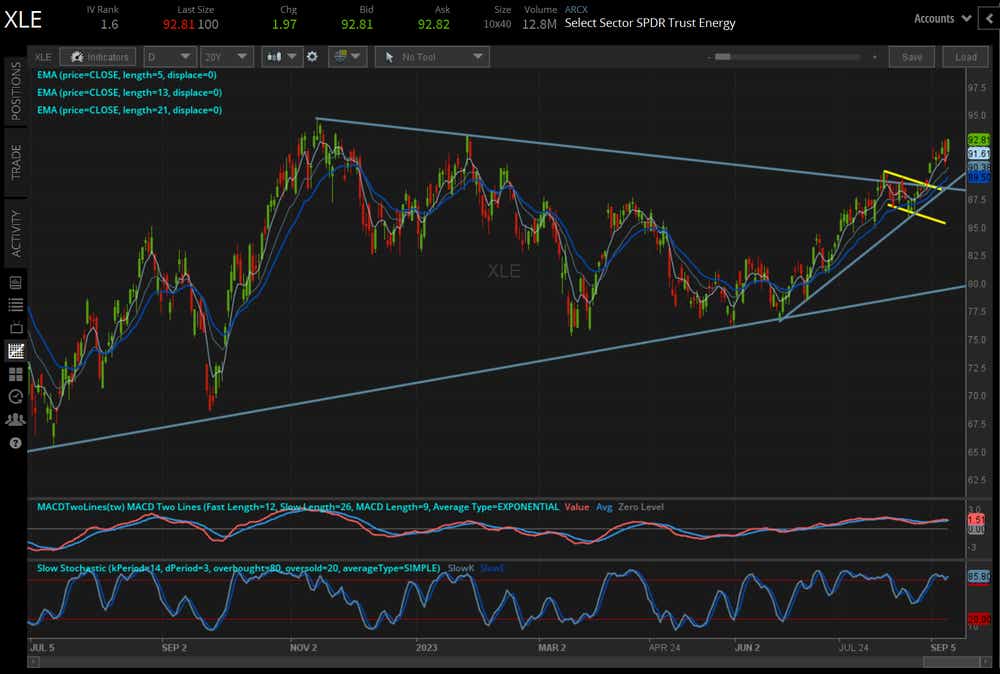
Riding higher on the back of /CLV3’s gains, XLE has extended to a fresh monthly high and is on the cusp of setting a fresh yearly high (set on January 26 at 93.15). The bull flag breakout remains in play and is buffeted by a consistently bullish momentum structure (across the daily EMA envelope, MACD, and slow stochastics). The technical structure continues to point to a return to the November 2022 high at 94.71.
XOP price technical analysis: daily chart (November 2022 to January 2023)
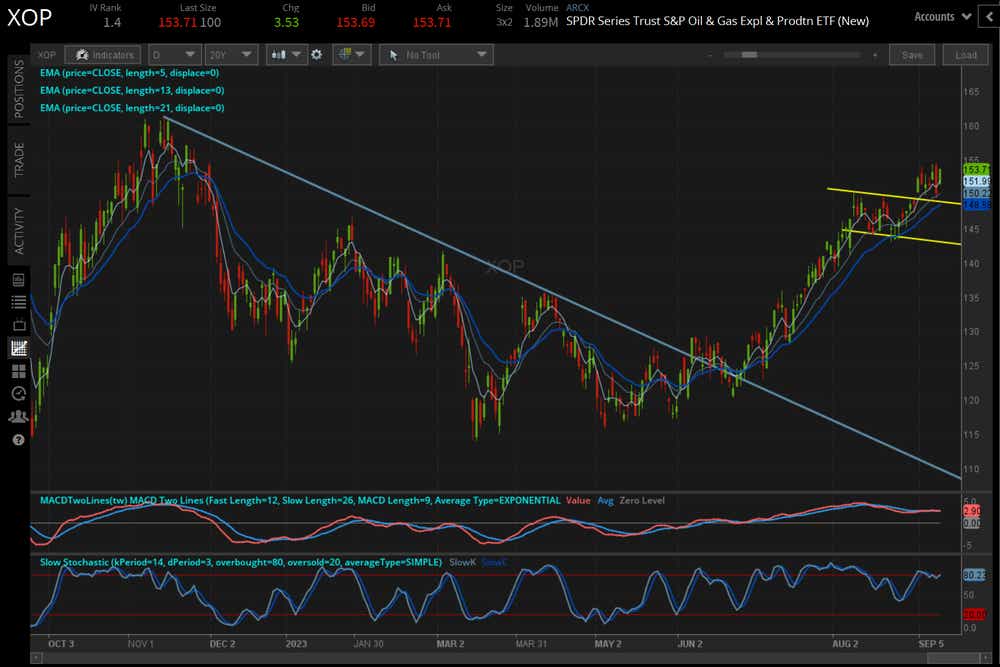
Like XLE, XOP is seeing its bull flag breakout continue to the upside. However, unlike XLE, it has yet to set a fresh monthly high, but when if it were to do so, it would also constitute a fresh yearly high. Nothing has changed from our last update: “the path of least resistance is for XOP to return to its November 2022 high at 161.42.”
CRAK Price Technical Analysis: Weekly Chart (September 2019 to September 2023)
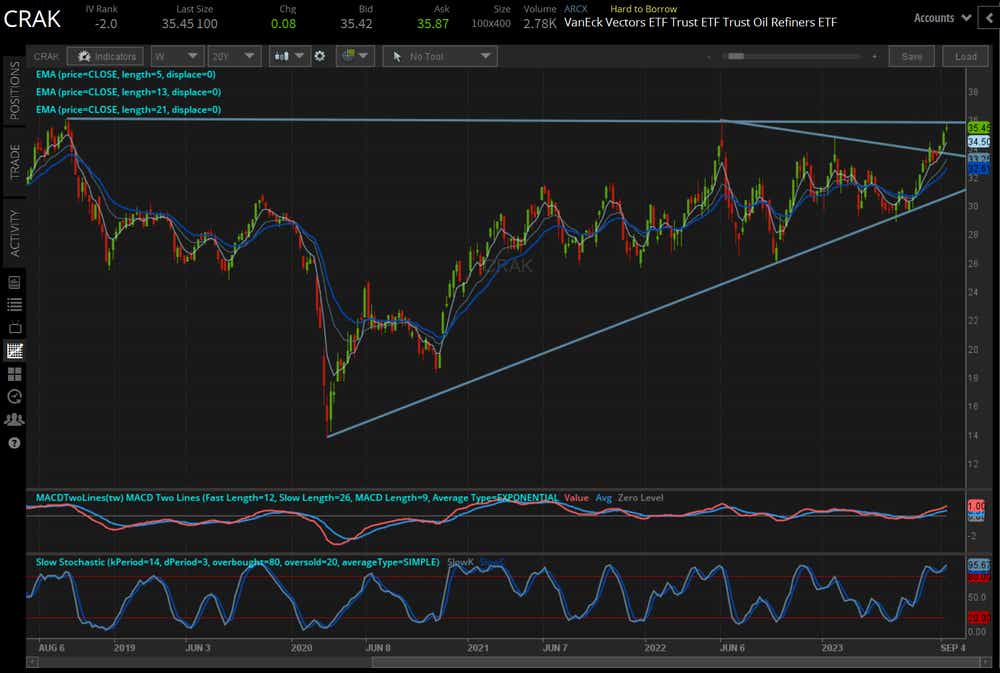
CRAK tracks refiners, not producers, like XLE and XOP. On the weekly chart, the symmetrical triangle that began in June 2022 has yielded a push to fresh yearly highs, leaving the refiners ETF on track to test the longer-term ascending triangle that may have formed dating back to 2018. Incidentally, this would mean taking out the all-time high at 36.01. It remains the cast that “all-time highs are in focus unless short-term momentum buckles.”
Christopher Vecchio, CFA, tastylive’s head of futures and forex, has been trading for nearly 20 years. He has consulted with multinational firms on FX hedging and lectured at Duke Law School on FX derivatives. Vecchio searches for high-convexity opportunities at the crossroads of macroeconomics and global politics. He hosts Futures Power Hour Monday-Friday and Let Me Explain on Tuesdays, and co-hosts Overtime, Monday-Thursday. @cvecchiofx
For live daily programming, market news and commentary, visit tastylive or the YouTube channels tastylive (for options traders), and tastyliveTrending for stocks, futures, forex & macro.
Trade with a better broker, open a tastytrade account today. tastylive, Inc. and tastytrade, Inc. are separate but affiliated companies.
Options involve risk and are not suitable for all investors. Please read Characteristics and Risks of Standardized Options before deciding to invest in options.