Crude Oil Prices Supported Tight By Physical Market

Crude Oil Prices Supported Tight By Physical Market
Bulls are rallying as inventory figures support buying. Plus, the OPEC July report notes deficits.
Crude oil bulls are rallying into the third quarter as inventory figures support buying.
OPEC sees crude oil deficits in Q3 in its July report.
Key oil spreads show a tightening physical market.
A rebound in Chinese demand may underpin physical tightness in the U.S. market.
Crude oil prices (/CLQ4) rose for a second day today, extending July's gain for the commodity to 1.6% and putting it on a solid footing as we enter the third quarter.
The buying comes after a weak second quarter, during which prices fell from April through June because demand fears permeated energy markets. Those fears are quickly dissolving as traders focus on forecasted deficits from oil industry groups.
U.S. Inventory data points to a rebound in demand starting in July
The Energy Information Administration’s weekly inventory report, released yesterday, was the first to capture inventory data for July.
The EIA report showed that for the week ending July 5, crude oil inventory fell by 3.4 million barrels. The market expected a drop of 3 million barrels. It added to the supply pressure in the market following last week’s draw of 12.2 million barrels. Gasoline and distillate fuel production increased for the week as well. Combined, these reports show the U.S. market is drawing on oil stocks as fuel product production ramps up.
Underlying figures in the EIA report underpinned the bullish narrative in oil markets, with total products supplied over the last four-week period rising 3% to 20.9 million barrels per day (bpd). Refinery inputs rose by 317,000 bpd to an average 17.1 million bpd, and refineries operated at 95.4% capacity.
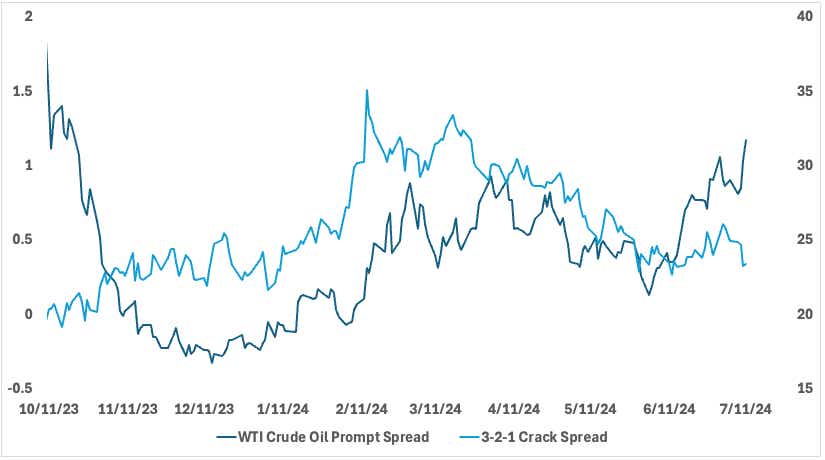
Crude oil crack spread and prompt spread: A tight physical market?
The increased throughput, along with higher finished gasoline inventory, pressured crack spreads. The gasoline/WTI spread fell over 5% to its lowest level since June 18. That behavior contrasted with what we’re seeing in the prompt spread (/CLQ4-/CLU4), which is at its highest level since October 2023—indicating a tight physical market. The prompt spread measures the difference between the front-month and subsequent month’s price.
A high prompt spread shows that physical demand for oil is strong, as near-term futures are parallel to spot prices.
We can try to write off the warning to weakness coming out of the crack spread by looking at increased throughput and fuel production figures. However, summer driving demand will have to meet expectations to incentivize refiners to keep buying crude.
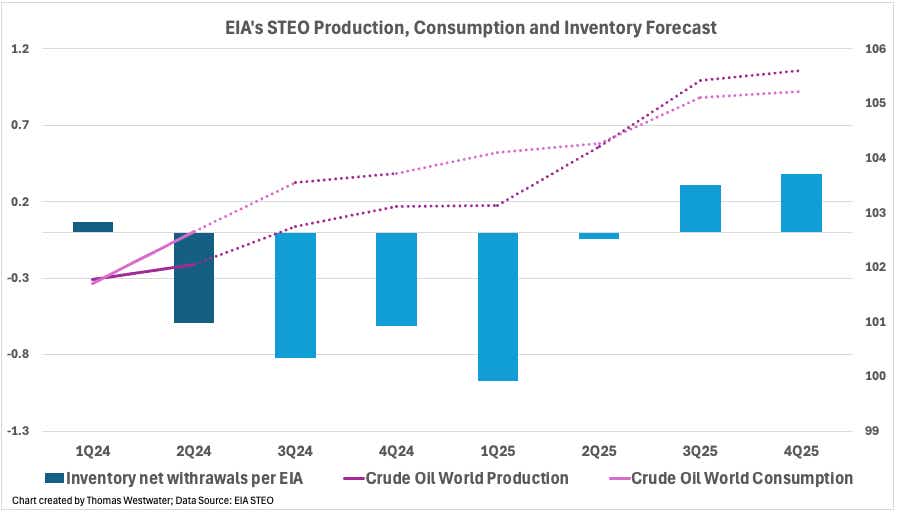
EIA and OPEC see inventory withdrawals accelerating in coming quarters
The Organization of the Petroleum Exporting Countries (OPEC) kept its world oil demand outlook unchanged in its July monthly oil market report (MOMR), released yesterday. The cartel expects world demand to increase by 2.25 million bpd and 1.85 million bpd in 2024 and 2025, respectively.
Russia’s production fell by 114,000 bpd in July, according to secondary sources. That brings the country’s total production to 9.139 million bpd, which is 161,000 bpd above its quota. The reduction is likely owed to some demand weakness in Asia, where Russia sells most of its oil at a discount. Russia’s refineries have also stepped up operations. Total OPEC production fell by 80,000 bpd.
The cartel sees a deficit in oil supply in the second half of this year (2H24) and into 2025. While OPEC projections are on the bullish end among industry groups’ forecasts, the EIA’s Short-Term Energy Outlook (STEO) also sees global inventories falling by 0.7 million bpd in 2H24, with inventory withdrawals accelerating in the third quarter before reversing in Q3 of 2025.
The reports support a bullish narrative for the coming months.
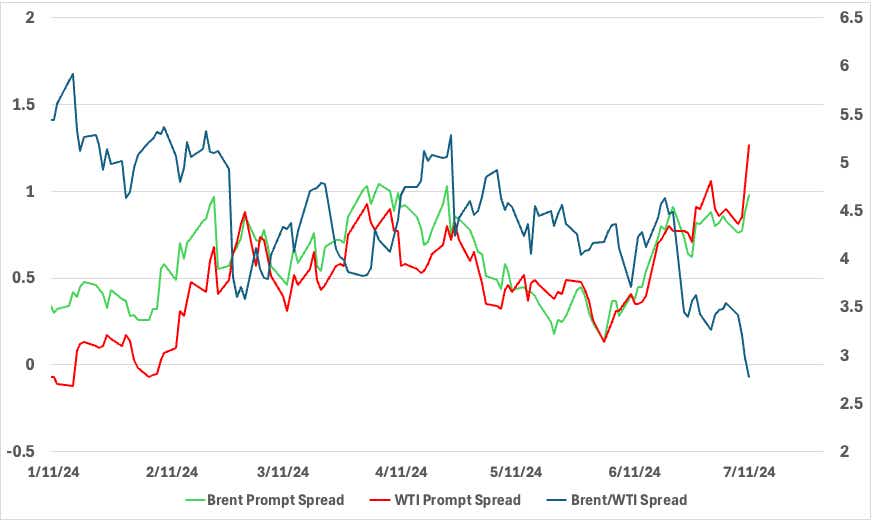
Brent/WTI spread narrows
On July 11, the Brent/WTI spread fell to its lowest level since October 2023, at $2.17 per barrel. That spread measures the price difference between Brent crude oil futures and West Texas Intermediate (WTI) crude oil futures (/CL).
Backwardation in the WTI market is outpacing Brent’s backwardation, implying that the physical market for U.S. products is tightening faster than its North Sea counterpart. This is likely explained, in part, by U.S. port closures from the recent storm in the Gulf Coast and demand weakness in China.
However, Dubai Brent crude oil prices have rebounded from their June levels, suggesting demand from Asia may strengthen over the coming months. Saudi crude prices for August dropped to $1.80 a barrel over the Dubai average, which could incentivize Asian customers to purchase more oil. If Asian customers increase their buying, it could underpin the tight U.S. physical market.
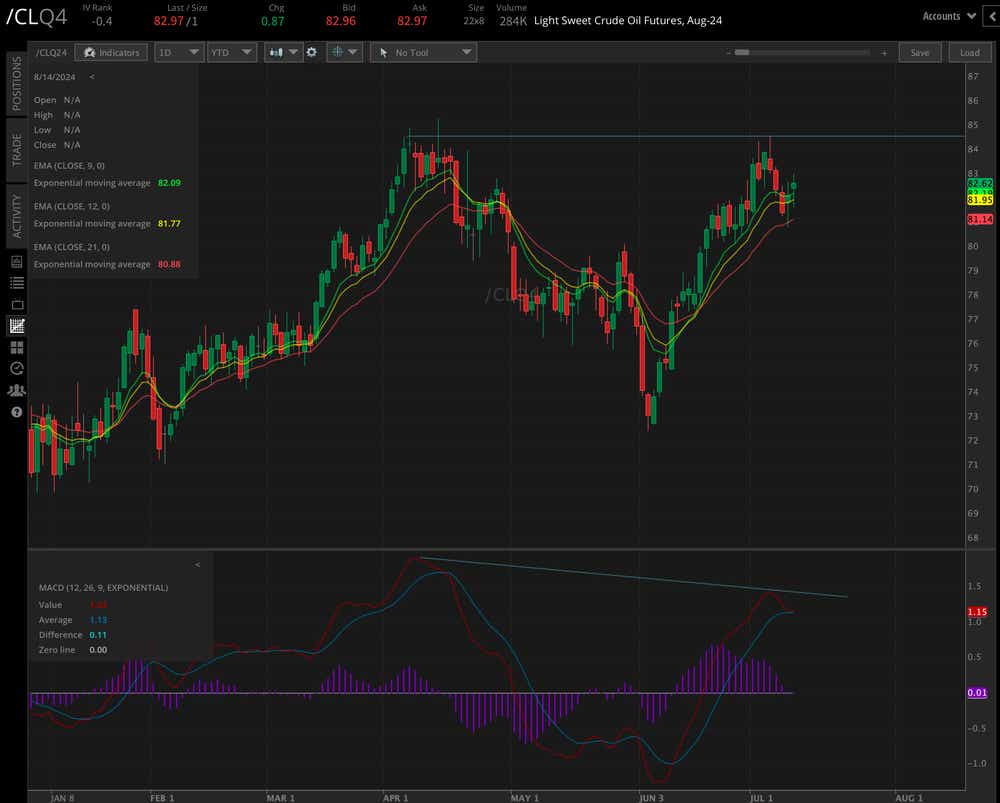
Crude oil technical outlook
Crude oil prices found intraday support yesterday at the 21-day exponential moving average (EMA), with prices subsequently rising to trade above the nine-day EMA, supporting the technical posture.
However, there is a negative moving average convergence/divergence (MACD) between the April swing high and last week’s swing high. The MACD also crossed below its signal line, underpinning the weakness displayed by the indicator.
The base formed from the late-June consolidation at the 80 handle would likely provide support on a down move. Overall, the technical outlook leans more to the bullish side, especially when considering market fundamentals. That said, traders will likely buy dips around 80 and sell rips into the July swing high around 84.52.
Thomas Westwater, a tastylive financial writer and analyst, has eight years of markets and trading experience. @fxwestwater
For live daily programming, market news and commentary, visit tastylive or the YouTube channels tastylive (for options traders), and tastyliveTrending for stocks, futures, forex & macro.
Trade with a better broker, open a tastytrade account today. tastylive, Inc. and tastytrade, Inc. are separate but affiliated companies.
Options involve risk and are not suitable for all investors. Please read Characteristics and Risks of Standardized Options before deciding to invest in options.