Can Corn Come Out of its Hole?

Can Corn Come Out of its Hole?
Corn prices remain volatile and uncertain following a washout week. Technicals are pointing lower.
- After a rally-destroying slide, corn prices moderated.
- Going forward, corn prices appear biased to the downside.
- The next several weeks will be critical for these planted acres.
Corn prices (/ZC) are moderating to start a holiday-shortened trading week following a 6.7% drop on Friday in the September contract, which brought its weekly loss to 16.46%—the largest decline on record.
That move fished wiping out the rally that started in May when drought conditions across much of the U.S. Upper Midwest—a region known as the corn belt—sent prices soaring from around $490 to nearly $630.
Weather outlook shifts to support bearish trading
Corn price volatility isn’t unusual for the late spring months of April through June when the newly planted crop is especially susceptible to unusual weather. While June precipitation totals ended on the low side, rain showers moved from Iowa to Ohio over the weekend, bringing much-needed moisture.
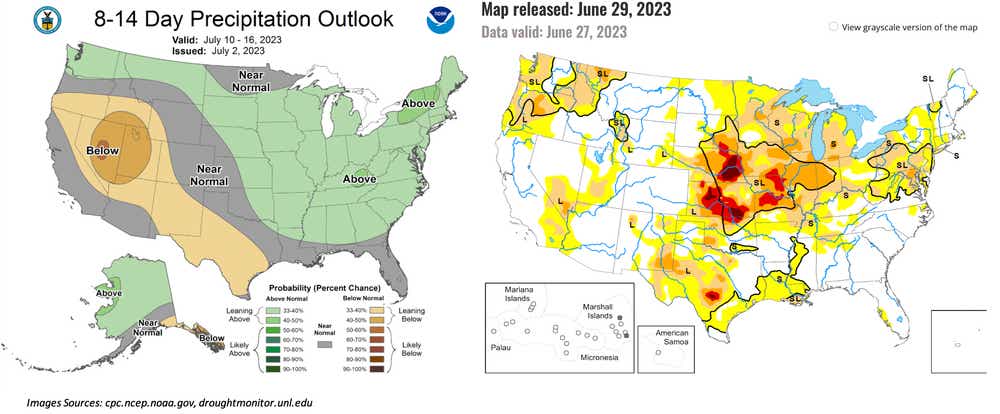
The image below shows the severity of drought across the corn belt as of June 27. The weather system should help to show some relief in next week’s update on Thursday. Other U.S. crops, including soybeans, have rallied during the abnormally dry conditions. A heat dome that blanketed the Southern U.S. has also dented crop conditions, as well as sending energy prices higher.
The outlook for corn prices remains biased lower following the improving weather conditions, and forecasters expect the chance for more rain. According to the National Weather Service’s eight- to 14-day precipitation outlook, there is an above-normal probability of rain, shown on the chart below.
Crop acreage report stuns speculative appetite
It’s not just the weather weighing on corn prices. According to the National Agricultural Statistics Service, the U.S. Department of Agriculture’s statistical branch, corn planted in the United States for 2023 rose 6% from last year, per its Acreage report released on Friday.
The NASS sees 94.1 million acres of corn planted, representing the highest acreage for the crop since 1944. The next several weeks will be critical for these planted acres, as the corn is in its pollination phase.
Meanwhile, corn exports remain weak this year. The USDA export sales report shows corn exports for 2022/2023 are down 16% from its prior four-week average, with net sales at 140,400 metric tons for the June 16-22 period.
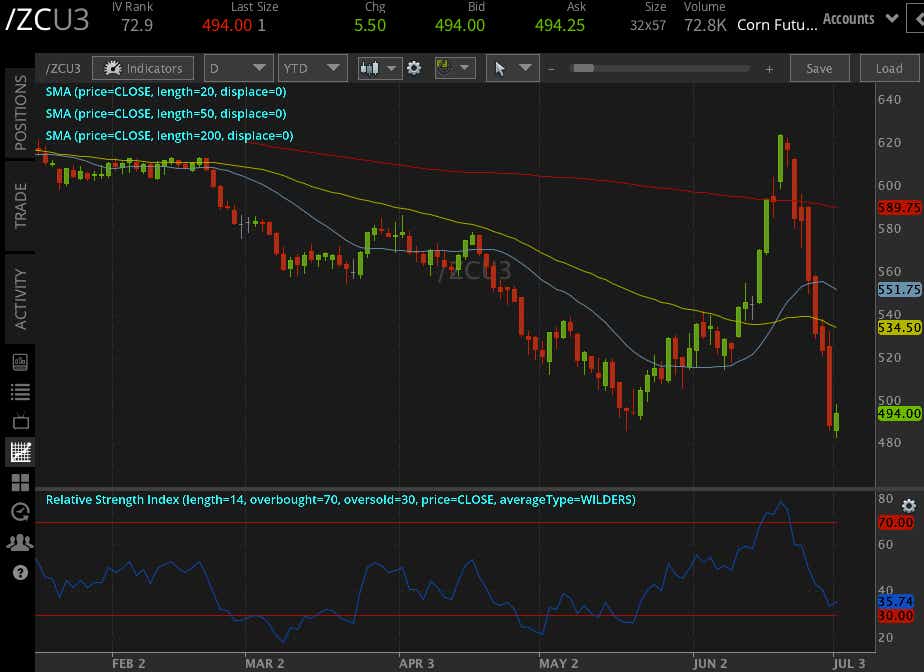
Corn chart shows downside risks
Corn prices appear biased to the downside when looking at the daily price chart. The grain is below all its major moving averages (20-day, 50-day, 200-day) following last week’s selloff. That puts prices in a disadvantaged position that bodes poorly for a quick recovery.
Monday’s bounce may be short-lived, and buyers appear to be waiting on the sidelines. The Relative Strength Index remains in neutral territory, but another down day could push the oscillator into “oversold” territory and potentially support more selling.
More Detail? Here are the export sales highlights from the USDA report ...
- Net sales of 140,400 metric tons (MT) for 2022/2023 were up noticeably from the previous week, but down 16 percent from the prior 4-week average.
- Increases primarily for Japan (103,700 MT, including 112,900 MT switched from unknown destinations and decreases of 3,600 MT), Mexico (92,700 MT, including decreases of 900 MT), Taiwan (18,500 MT), Jamaica (18,100 MT), and El Salvador (8,300 MT, including 7,500 MT switched from Honduras and decreases 900 MT), were offset by reductions for unknown destinations (87,500 MT), Colombia (14,500 MT), and Honduras (6,300 MT).
- Net sales of 123,500 MT for 2023/2024 were reported for Mexico (79,500 MT), Honduras (29,400 MT), and Canada (14,600 MT). Exports of 605,300 MT were down 9 percent from the previous week and 47 percent from the prior 4-week average.
- The destinations were primarily to Mexico (315,600 MT), Japan (138,300 MT), Colombia (53,400 MT), El Salvador (24,400 MT), and Panama (19,700 MT).
Thomas Westwater, a tastylive financial writer and analyst, has eight years of markets and trading experience. @fxwestwater
For live daily programming, market news and commentary, visit tastylive or the YouTube channels tastylive (for options traders), and tastyliveTrending for stocks, futures, forex & macro.
Trade with a better broker, open a tastytrade account today. tastylive, Inc. and tastytrade, Inc. are separate but affiliated companies.
Image generated with Midjourney.
Options involve risk and are not suitable for all investors. Please read Characteristics and Risks of Standardized Options before deciding to invest in options.