XLU: Reflecting on 15 Utility Stocks

XLU: Reflecting on 15 Utility Stocks
By:Tim Knight
How to trade the Dow 15 Utilities (XLU) on the heels of extraordinary price action over just the past twenty days
What has taken place with the Dow 15 Utilities (and its trade-able counterpart, the fund XLU) over just the past twenty days has been nothing short of extraordinary. Let's examine this instrument and what appears to be forthcoming.
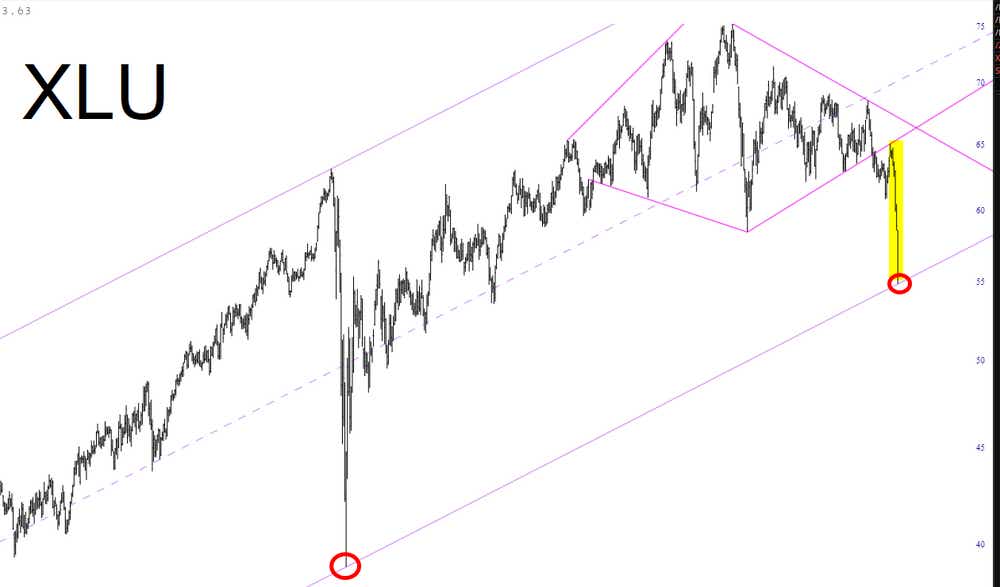
Just to jump to the end of this film, here is the present Dow Utilities. The red arrow marks the point where I established my bearish position, and the green arrow marks where I established my bullish position. As some folks know (because I never stop talking about it), the bearish position created a profit of over 300% in just two weeks. I got out at the +140% mark and haven't stopped kicking myself.
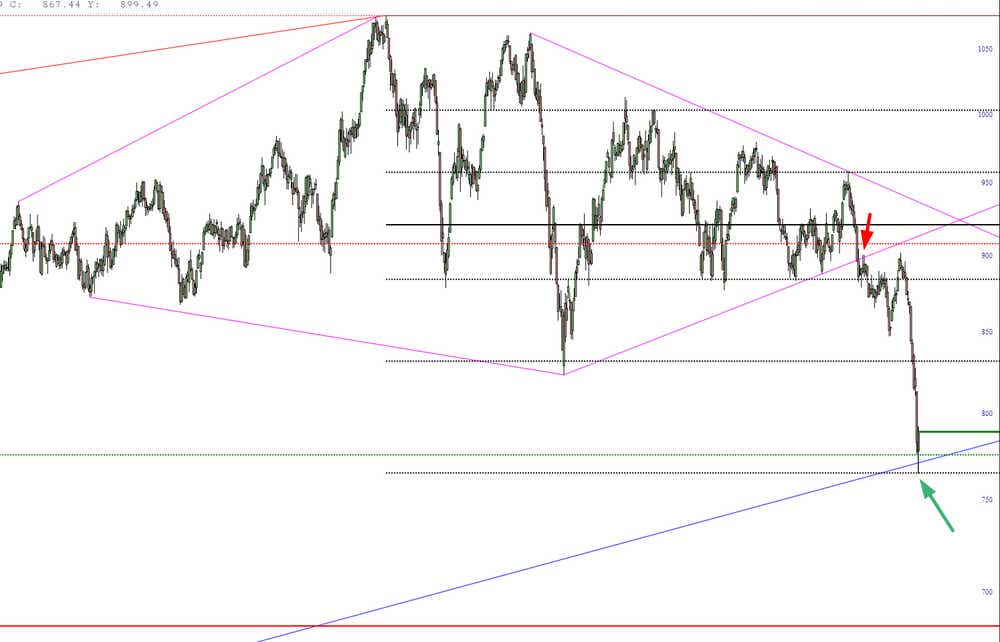
I didn't anticipate going long XLU until the start of October because the absolutely explosive increase in volume, coupled with the remarkable strength of the support zones, convinced me it was worth the risk to take an utterly opposite trade to the one I assembled on the Sept. 15.

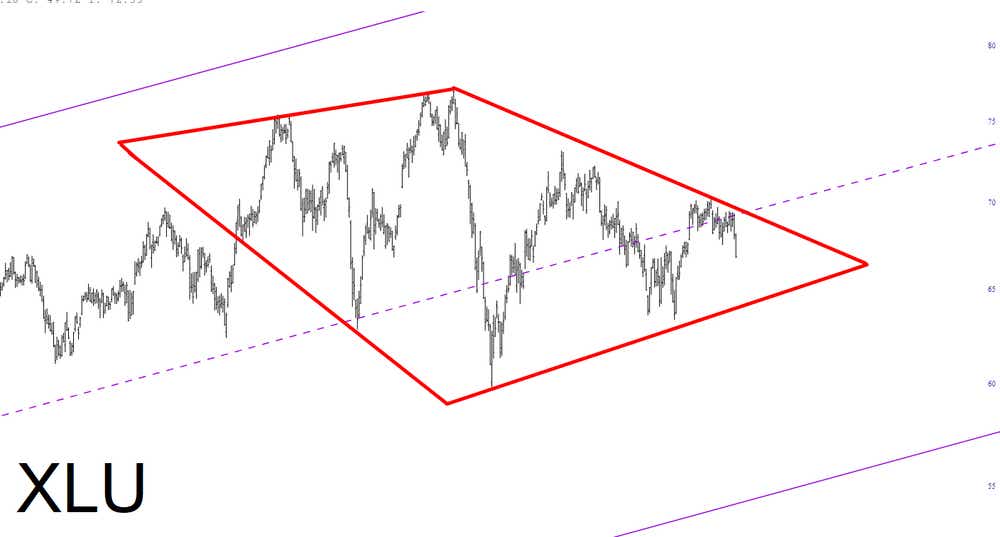
Looking back through my archives, I "discovered" the diamond pattern on the XLU a full five months ago, in May. It was a remarkably well-formed pattern, and although it would have plenty of ups and downs, it never beat the most recent high it had already established.
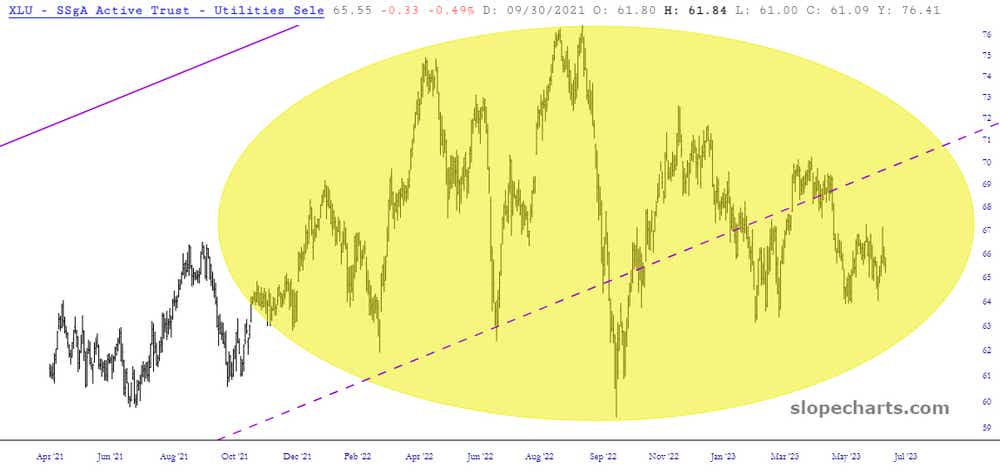
As the pattern continued to develop, the clarity of the diamond became even more clear, and I used this oval tool to envelop what I perceived as the price pattern. It was astonishingly clean.
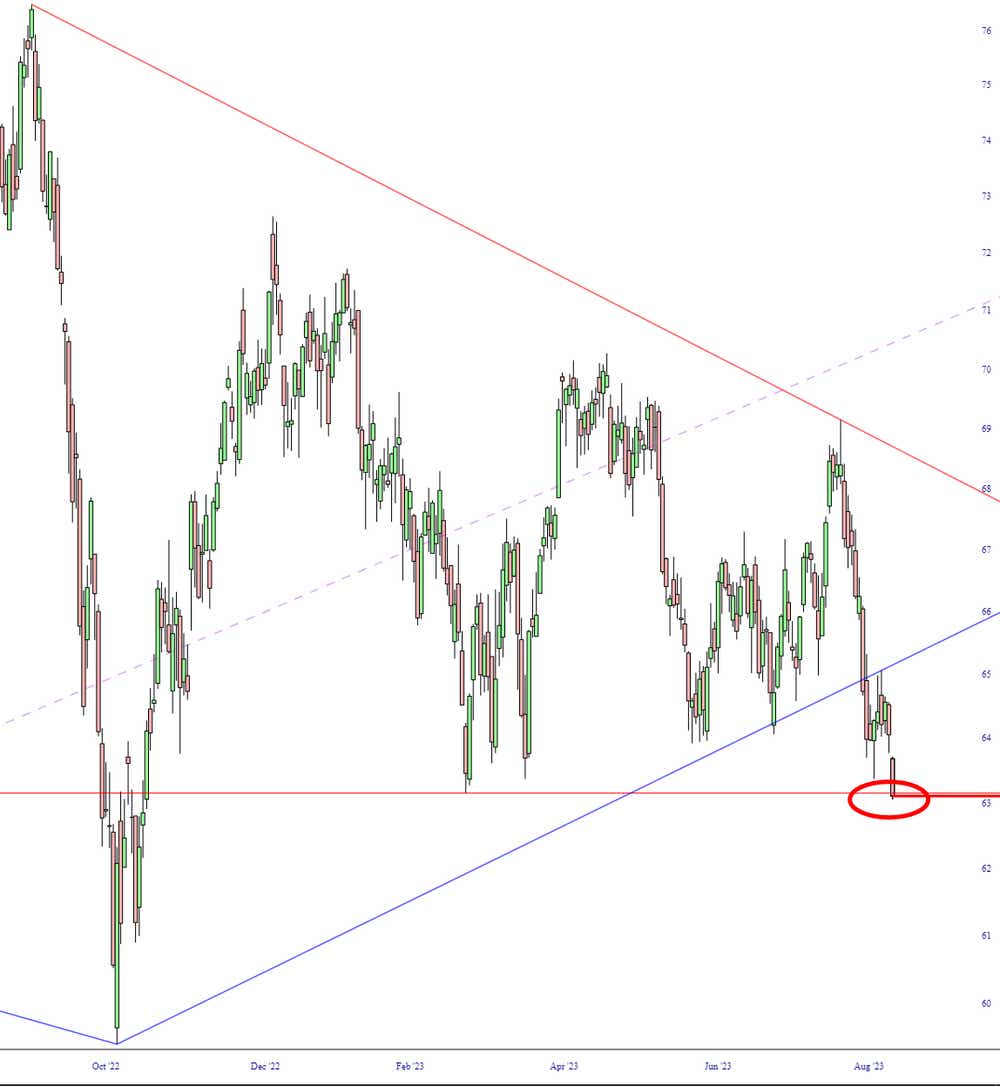
A core break took place early in August.
As the stock began a series of lower lows and lower highs, I had refined the parameters of the pattern as illustrated here. At the time, I went out on a limb and tinted in green the most extreme hope for how far XLU might fall. Incredibly, this almost perfectly nailed the drop that was going to ensue. (It actually went a little lower than this zone suggested).
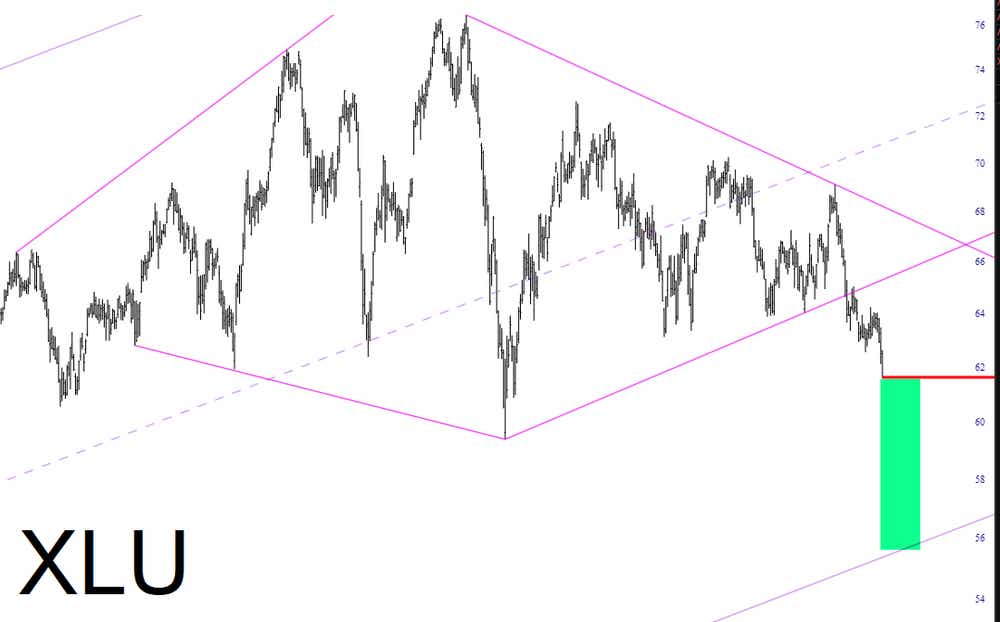
Because of XLU's volatility, I had plenty of false starts and ham-handed screw-ups along the way. Finally, on Sept. 15, the setup became absolutely irresistible. I piled into puts with the biggest position I had ever had.
Even though I shared the particulars of my trade idea behind a pay wall, I was so excited about the trade that I did this post on my X.com account. In retrospect, it turned out to be just about the perfect opportunity to buy puts, almost to the millisecond.

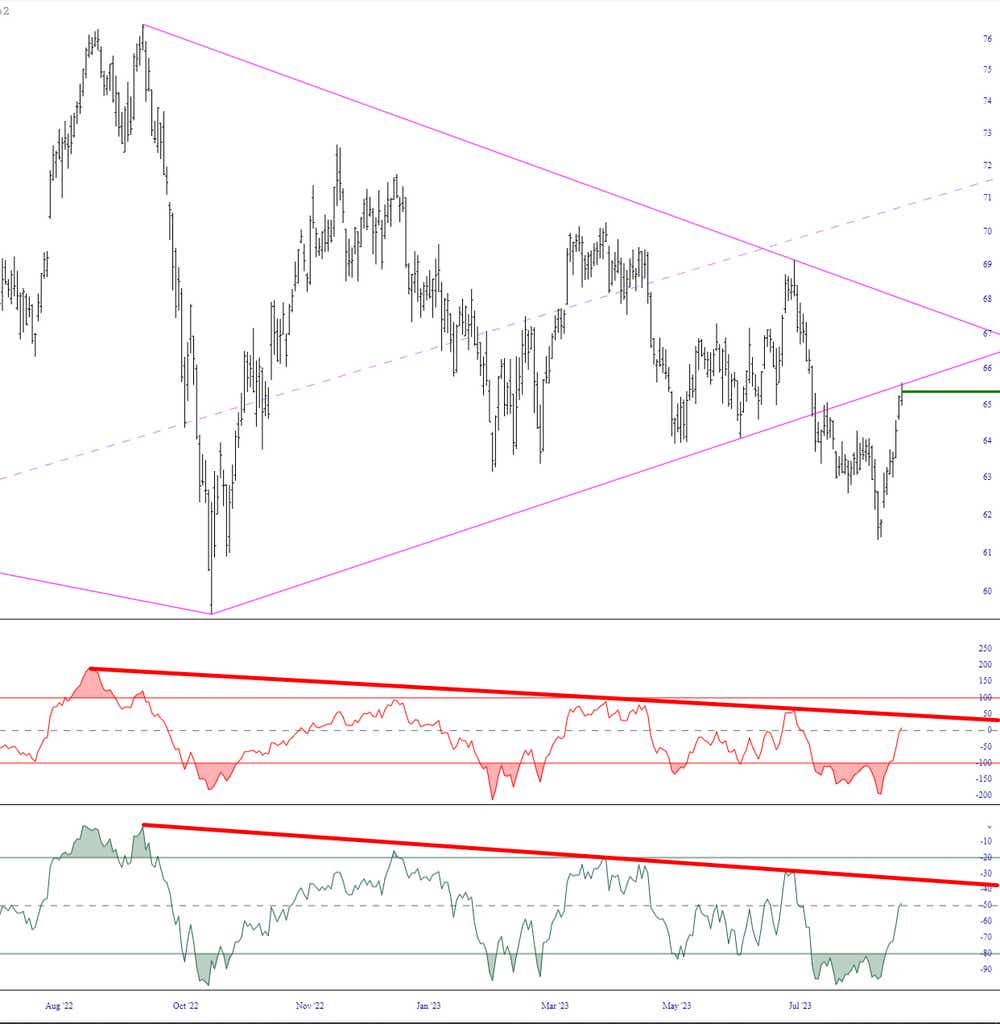
After that point, it fell virtually every day, and with increasing speed. As of this writing, it seems to have bottomed out on tremendous volume, nailing for only the second time in history a trendline that goes back almost a quarter of a century!
The bottom line is that stocks (and exchange-traded funds) have personalities, just like people, and it's valuable to get along with the right financial instruments. My friendship with XLU the past few months has been going splendidly. If it bounces, as I am anticipating, this will definitely be a beautiful friendship.

Tim Knight, a charting analyst with 35 years of trading experience, hosts Trading Charts, a tastylive segment airing Monday-Friday. He founded slopeofhope.com in 2005 and uses it as the basis of his technical charting and analysis. Knight authors The Technician column for Luckbox magazine.
For live daily programming, market news and commentary, visit tastylive or the YouTube channels tastylive (for options traders), and tastyliveTrending for stocks, futures, forex & macro.
Trade with a better broker, open a tastytrade account today. tastylive, Inc. and tastytrade, Inc. are separate but affiliated companies.
Options involve risk and are not suitable for all investors. Please read Characteristics and Risks of Standardized Options before deciding to invest in options.