S&P 500, Nasdaq 100 Break Series of Lower Highs

S&P 500, Nasdaq 100 Break Series of Lower Highs
The S&P 500 is up 5.27% month-to-date. U.S. inflation and retail sales reports in the coming days could move stock prices.
- Equity markets are treading water after a strong start to November.
- An intraday rally by bonds is taking pressure off the Russell 2000 (/RTYZ3) and Nasdaq 100 (/NQZ3).
- The October U.S. inflation and retail sales reports in the coming days offer a potent binary event risk on the immediate horizon.

U.S. stock markets took a breather for most of last week after an astonishing start to November, but a surge on Friday saw each of the Dow Jones (/YMZ3), Nasdaq 100 (/NQZ3), and S&P 500 (/ESZ3) trade through their mid-October swing highs.
An important technical development, these jumps represent the end of the series of lower highs and lower lows since the yearly highs set in July.
The newly minted bullish technical postures are not in the free and clear yet, however. Several meaningful earning releases are due in the coming days, from Home Depot (HD), TJX Companies (TJX), Walmart (WMT), and BJ’s Wholesale Club (BJ).
Also, the October U.S. inflation rate (consumer price index) and retail sales reports will hit the wires between Tuesday and Wednesday. Volatility metrics may have come down, but meaningful bouts of binary event risk are right around the corner.
/ES S&P 500 price technical analysis: daily chart (September 2022 to November 2023)
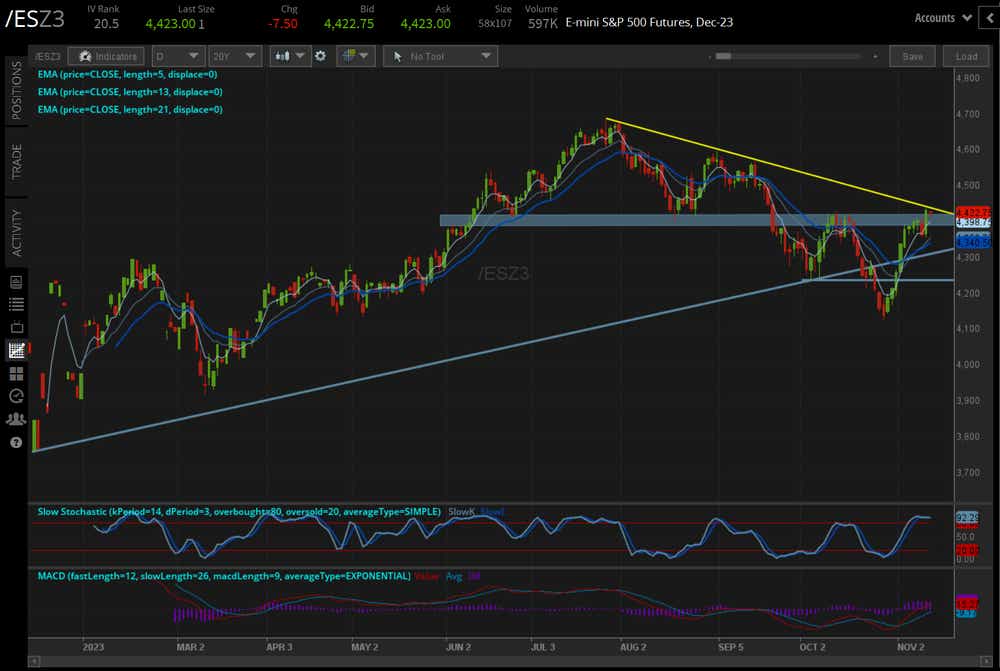
/ESZ3 has started to chip away at the 4380/4420 zone–an area that has been both support and resistance dating back to early-June, and perhaps the neckline of a now-completed head-and-shoulders pattern—and scaled the 4430.50 high seen in mid-October. Now, downtrend resistance from the July and September highs remains, coming it between 4430/35 over the coming days.
Momentum has improved meaningfully. /ESZ3 is above its daily five-, 13-, and 21-day exponential moving average (EMA) envelope, which is in bullish sequential order. Slow stochastics are holding in overbought territory and moving average convergence/divergence (MACD) crossed above its signal line for the first time Sept. 14. A close above 4435 this week would offer strong confirmation that materially significant lows have been formed.
/NQ Nasdaq 100 price technical analysis: daily chart (December 2022 to November 2023)
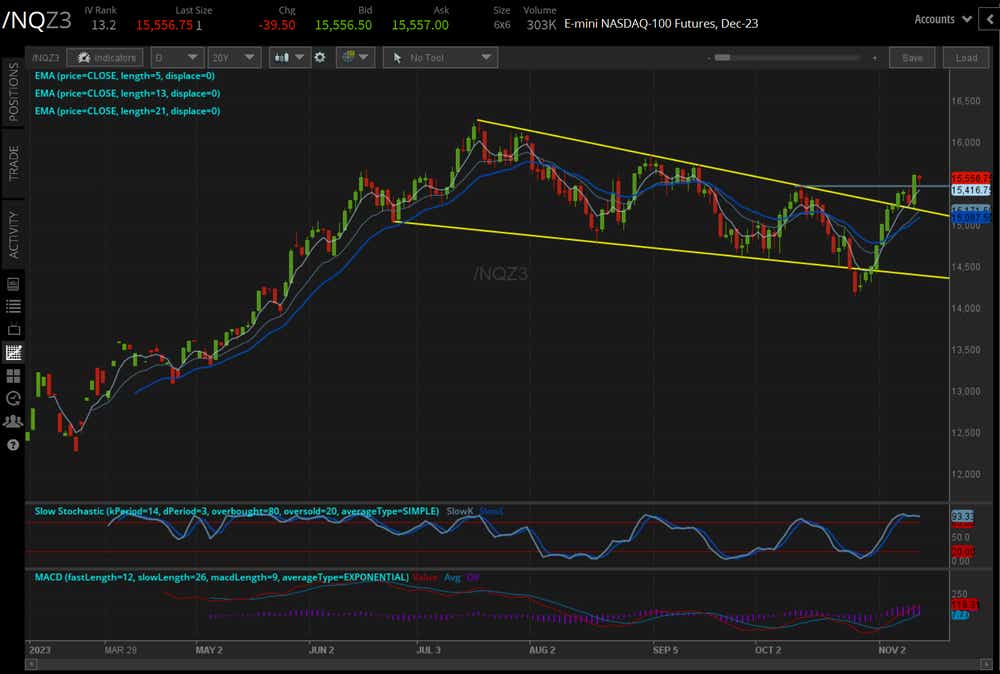
Last week we noted that “/NQZ3 is finding resistance around 15250, which marks the descending trendline from the July, September, and October swing highs. This multi-month resistance may also constitute the upper band of a bullish falling wedge, which is why hurdling this resistance is so critical for the next directional move. Above this trendline, the bullish falling wedge comes into play, ultimately targeting a return to the yearly high at 16264.25; failure here would open the door for a return below 14500.”
Resistance has cleared up; the bullish falling wedge is the primary technical interpretation for the near future.
/RTY Russell 2000 price technical analysis: daily chart (April 2023 to November 2023)
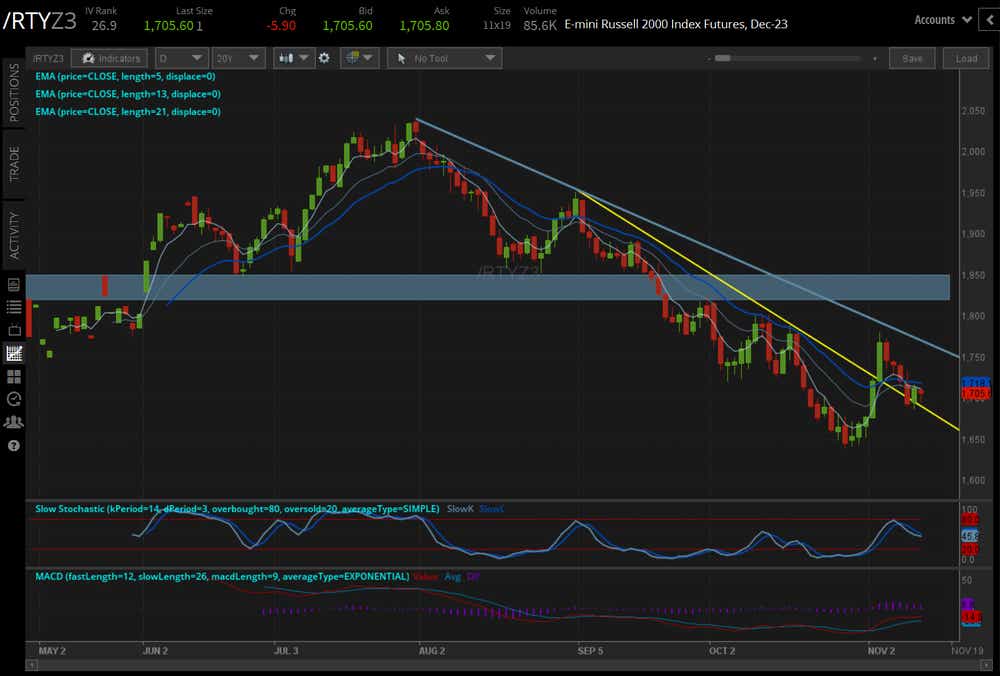
/RTYZ3 had the most disappointing week among the major indexes last week. As previously stated, “holding above 1720/22 (early-October swing lows and the daily 21-EMA) will be critical to establish a higher low; below 1720/22, the bullish breakout will have failed.”
Indeed, /RTYZ3 fell below this area, and traded below its daily 21-day EMA (one-month moving average). While the index is still trading above the downtrend off the September and October swing highs, there is a lot more work to be done before bulls can feel comfortable in any serious fashion.
Christopher Vecchio, CFA, tastylive’s head of futures and forex, has been trading for nearly 20 years. He has consulted with multinational firms on FX hedging and lectured at Duke Law School on FX derivatives. Vecchio searches for high-convexity opportunities at the crossroads of macroeconomics and global politics. He hosts Futures Power Hour Monday-Friday and Let Me Explain on Tuesdays, and co-hosts Overtime, Monday-Thursday. @cvecchiofx
For live daily programming, market news and commentary, visit tastylive or the YouTube channels tastylive (for options traders), and tastyliveTrending for stocks, futures, forex & macro.
Trade with a better broker, open a tastytrade account today. tastylive, Inc. and tastytrade, Inc. are separate but affiliated companies.
Options involve risk and are not suitable for all investors. Please read Characteristics and Risks of Standardized Options before deciding to invest in options.