The S&P 500 is Below Resistance, While the Nasdaq 100 Holds Support

The S&P 500 is Below Resistance, While the Nasdaq 100 Holds Support
Three of the four major indexes are still in the red for the first few days of December
- U.S. stock markets are trying for their sixth straight week of gains.
- The S&P 500 (/ESZ3) has been constrained by the September swing high, while the Nasdaq 100 (/NQZ3) is treating the September high as a new level of support.
- The Russell 2000 (/RTYZ3) continues to make progress in the context of an inverse head and shoulders pattern.
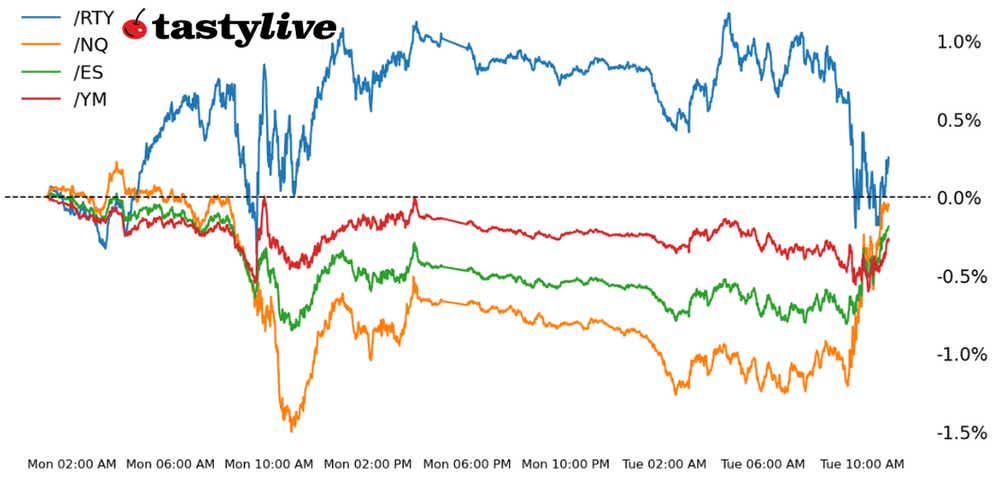
Market Update: Russell 2000 up +3.26% month-to-date
The first few days of December have brought mixed results for U.S. equity markets. Three of the four major indexes are still in the red, although the Russell 2000 (/RTYZ3) is posting a solid starting, gaining more than 3% through the first three days of trading this month.
Markets received a jolt this morning, however, when the October U.S. job openings and labor turnover survey (JOLTS) showed a sharp deceleration in job openings in the country, falling from 9.35 million in September to 8.733 million in October. Coupled with rising weekly U.S. continuing jobless claims, it’s evident the U.S. labor market is quickly normalizing to a degree the Federal Reserve will find acceptable.
In turn, a bump in Fed rate cut odds for March helped U.S. Treasury yields drop across the curve, providing a bit of solace for U.S. equity markets this morning. Each of the S&P 500 (/ESZ3), Nasdaq 100 (/NQZ3), and Dow Jones 30 (/YMZ3) are now down less than 0.5% month-to-date. Technically speaking, multi-week consolidations in the former two keep intact bullish setups.
/ES S&P 500 Price Technical Analysis: Daily Chart (September 2022 to December 2023)

The S&P 500 (/ESZ3) has spent the better part of the past three weeks hovering below the September swing high at 4597.50. That said, /ESZ3 has closed above its daily five-EMA (one-week moving average) every session since Nov. 10, illustrating how sturdy the uptrend has been.
Momentum remains bullish, even if the rally has stalled. /ESZ3 is still above its daily five-, 13- and 21-EMA envelope, which remains in bullish sequential order. Slow stochastics continue to linger in overbought territory, and MACD (the moving average convergence/divergence) is holding well-above its signal line. A move above 4597.50 would open up the ceiling for a return to the yearly high at 4685.25.
/NQ Nasdaq 100 Price Technical Analysis: Daily Chart (December 2022 to December 2023)
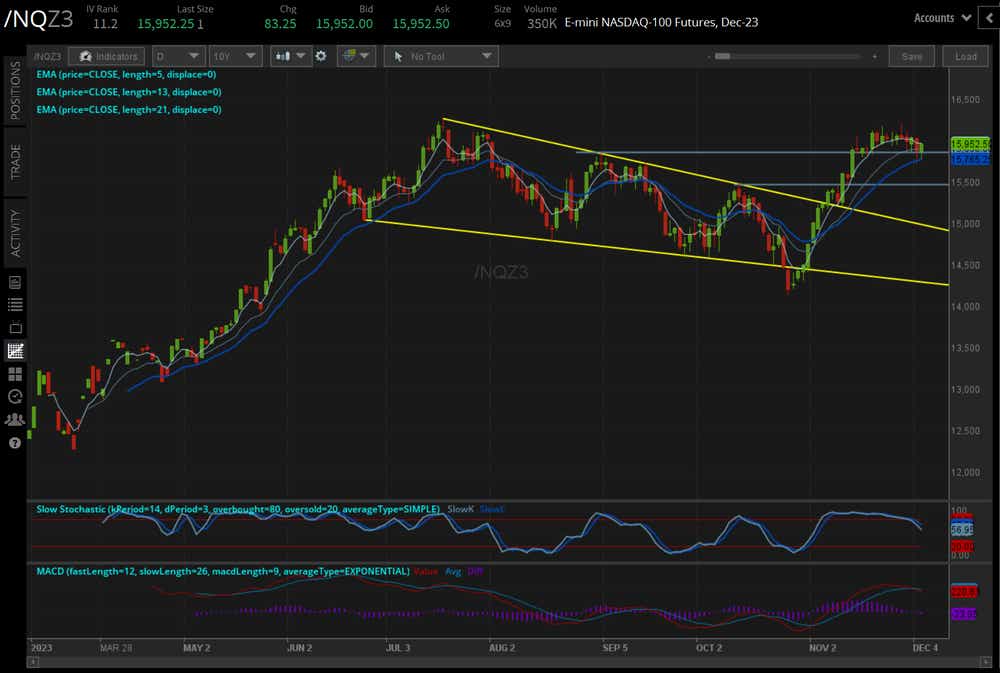
Like /ESZ3, the Nasdaq 100 (/NQZ3) has been chopping around since the middle of November. However, it has treated the September high as support rather than resistance, highlighting the resiliency of the index. Momentum has eroded, but the lack of decline is likewise an illustration that bulls remain firmly in control.
/NQZ3 is moving back above its daily five-EMA, and the EMA envelope is still in bullish sequential order. Slow Stochastics have dropped out of overbought territory yet there’s been no correction in price, and MACD is declining but remains well above its signal line. Accordingly, nothing has changed: The bullish falling wedge is the primary technical interpretation for the foreseeable future, targeting a return to the yearly high at 16264.25.
/RTY Russell 2000 Price Technical Analysis: Daily Chart (April to December 2023)
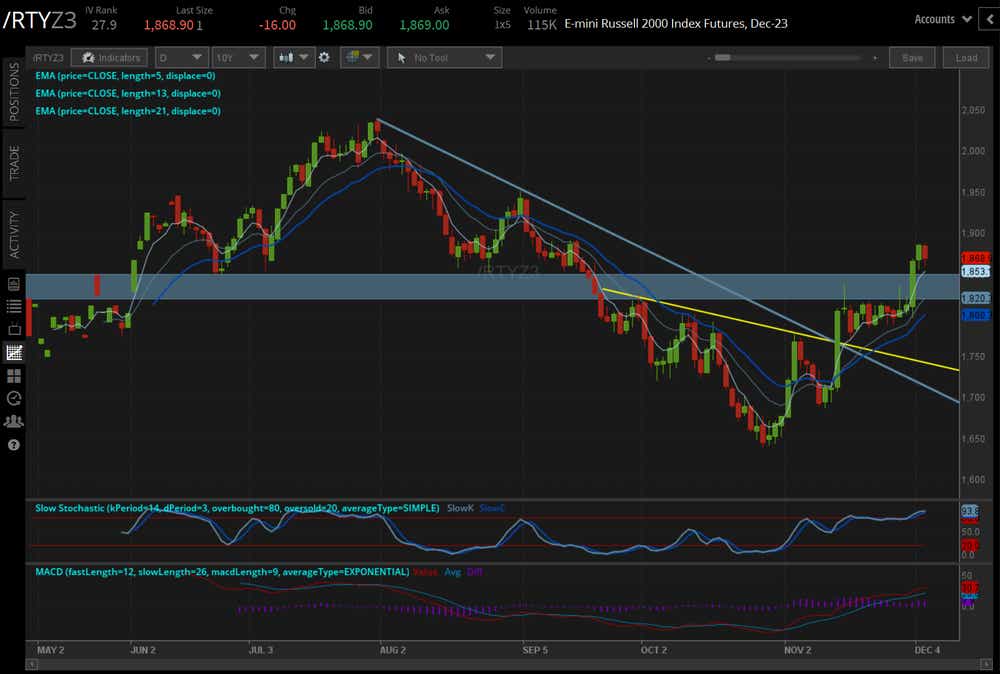
The Russell 2000 (/RTYZ3) is falling back today, but has made meaningful technical strides in recent days, finally scaling the critical 1820/50 area (which has been both support and resistance since the regional banking crisis in March). The breakout above the descending trendline from the August and September highs as well as the neckline of an inverse head and shoulders pattern continues. As noted last week, “/RTYZ3 [remains] on favorable footing for the foreseeable future.”
Christopher Vecchio, CFA, tastylive’s head of futures and forex, has been trading for nearly 20 years. He has consulted with multinational firms on FX hedging and lectured at Duke Law School on FX derivatives. Vecchio searches for high-convexity opportunities at the crossroads of macroeconomics and global politics. He hosts Futures Power Hour Monday-Friday and Let Me Explain on Tuesdays, and co-hosts Overtime, Monday-Thursday. @cvecchiofx
For live daily programming, market news and commentary, visit tastylive or the YouTube channels tastylive (for options traders), and tastyliveTrending for stocks, futures, forex & macro.
Trade with a better broker, open a tastytrade account today. tastylive, Inc. and tastytrade, Inc. are separate but affiliated companies.
Options involve risk and are not suitable for all investors. Please read Characteristics and Risks of Standardized Options before deciding to invest in options.