S&P 500, Nasdaq 100, Dow Jones Talking Points
S&P 500, Nasdaq 100, Dow Jones Talking Points
We’re not quite two weeks into Q2 trade and, so far, it hasn’t been a great outing for stocks. The S&P 500 set its most recent three-month-high in the final days of Q1 and since then sellers have started to return in a manner similar to what was on display ahead of the FOMC rate hike last month.
But, after the Fed hiked by only 25 basis points while avoiding the topic of Quantitative Tightening, stocks ripped for the next two weeks with the Nasdaq 100 tacking on a whopping 17.92% in less than two weeks. The S&P 500 gained a more modest 12.14% from that March low up to the March high but, already we’ve seen 50% of that move erased. The 50% retracement of that move plots right at 4380 and this is the price that’s been holding the lows in the S&P 500 over the past couple of days.
That level syncs up with another level of interest, plotted around 4377, which is a Fibonacci level taken from a longer-term setup. This zone has come into play after a descending triangle had set prior support around 4445, which was breached after this week’s open.
S&P 500 FOUR-HOUR PRICE CHART
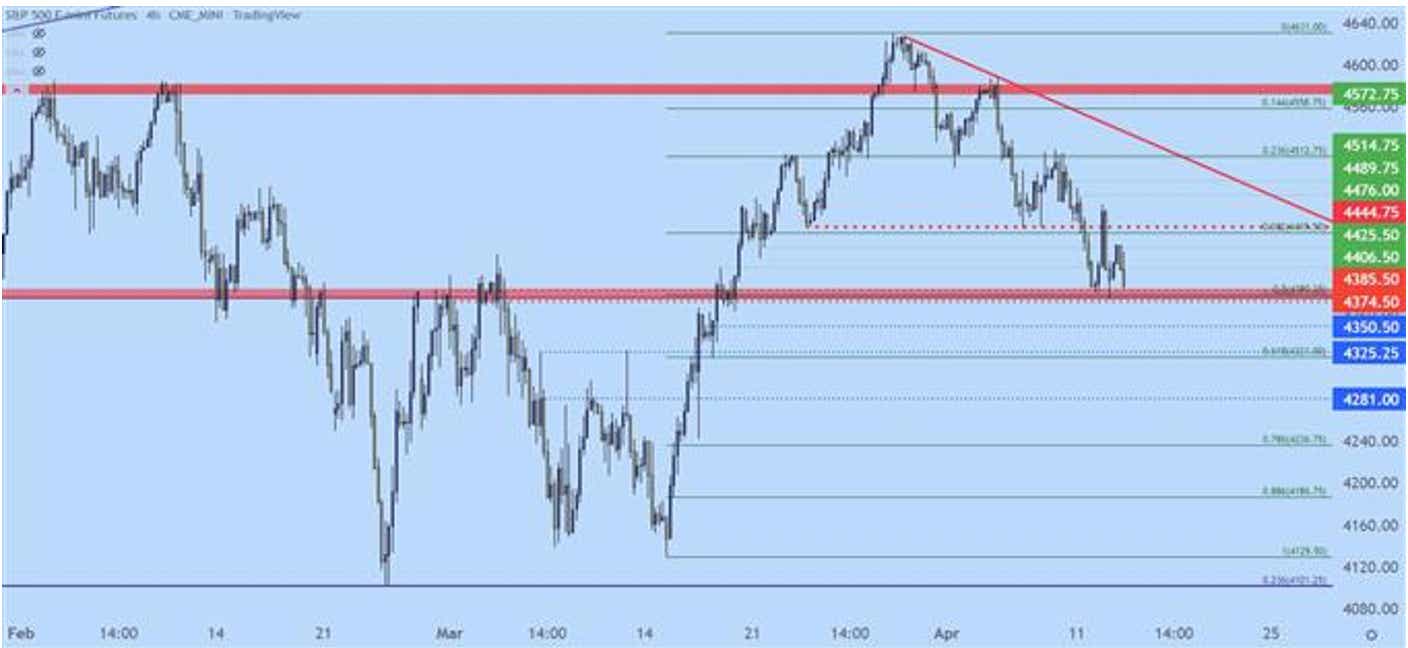
Chart prepared by James Stanley; S&P 500 on Tradingview
S&P 500 LONGER-TERM
The concern at this point from the daily chart would be short-term oversold conditions. There’s been a stark change-of-pace around this quarter’s open and this means that there’s likely many traders that are looking to play reversals after a strong sell-off . And from the daily chart below, we can see where this current support zone was resistance in late-February and early-March, which keeps the door open for short-term bullish scenarios that could ease those shorter-term oversold conditions showing in the index, which could then re-open the door for longer-term short scenarios.
For near-term resistance, 4425 and prior triangle support loom large at 4445. For deeper support, the area from 4321-4325 looms large, after which the 4281 level comes into view.
S&P 500 DAILY PRICE CHART
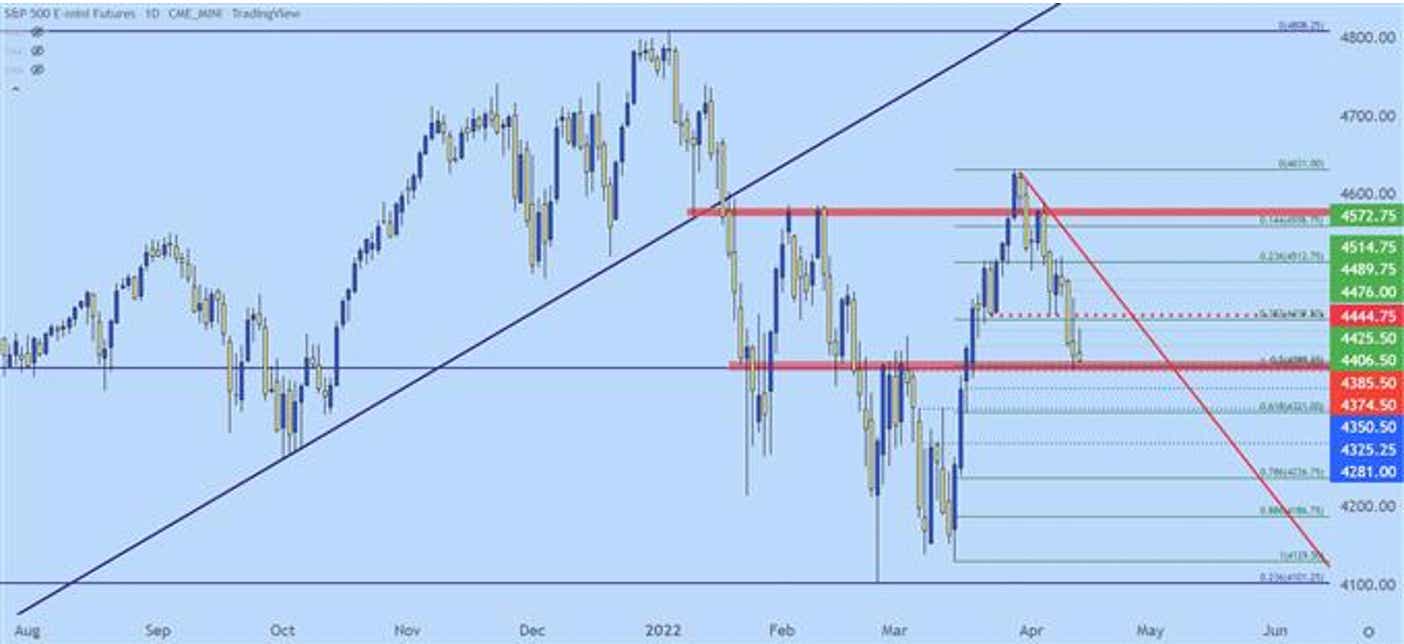
Chart prepared byJames Stanley; S&P 500 on Tradingview
NASDAQ 100 STALL AT MAJOR ZONE
In the Nasdaq 100, the index came into Q2 carrying a double top formation, which can be a sign of possible bearish reversals. Resistance had held strong around 15,300 over two separate occasions and support for the formation, called the ‘neckline’ was well formed around the 13K handle that proved really tough to break last year.
For the formation to come into play support would need to be breached at the neckline, which opens the door for a potentially large move. Some traders will build target projections for double top formations by calculating the difference from the top the neckline, and then looking for a move of that size. And with resistance at 15,300 with support around 13K, that would mean approximately 2,300 points of target potential below that support zone, which would project to approximately 10,750.
That level is right around the 38.2% retracement of the post-Financial Collapse move and this is a zone that was functioning as resistance turned support in the second-half of 2020 trade.
NASDAQ 100 DAILY PRICE CHART
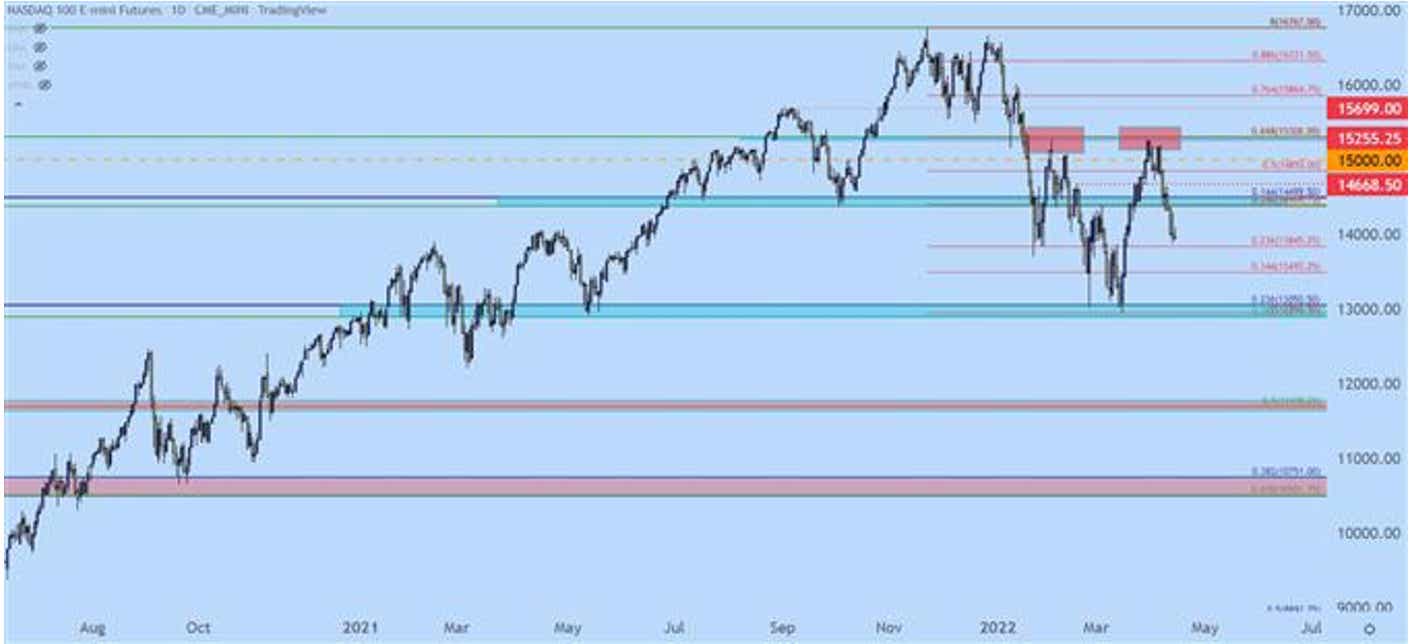
Chart prepared by James Stanley; Nasdaq 100 on Tradingview
NASDAQ 100 SHORTER-TERM
Before the neckline of that double top might ever come into play, the Nasdaq 100 is going to have to deal with a stubborn spot of support that’s shown up around the 14k handle. The levels of 13,900 and 14,059 have had some pull on price action going back to last year.
The former of those levels came into play as the February 2021 swing high while the latter level helped to cauterize resistance in April before bulls forced a breakout later that summer.
This same area came into play as support in January before showing short-term resistance in February. Bulls forced a breakout from this zone after the FOMC rate decision but, already prices are back to testing support in this key area on the chart. It’s so far stalled an aggressive sell-off but there’s little sign at this will function as more than a speed bump.
Near-term resistance potential exists at 14,184 and then the zone from 14,375-14,500. For bulls to get back in the driver’s seat, they’d likely want to see a closed daily candle through that 14,500 level.
NASDAQ 100 DAILY PRICE CHART
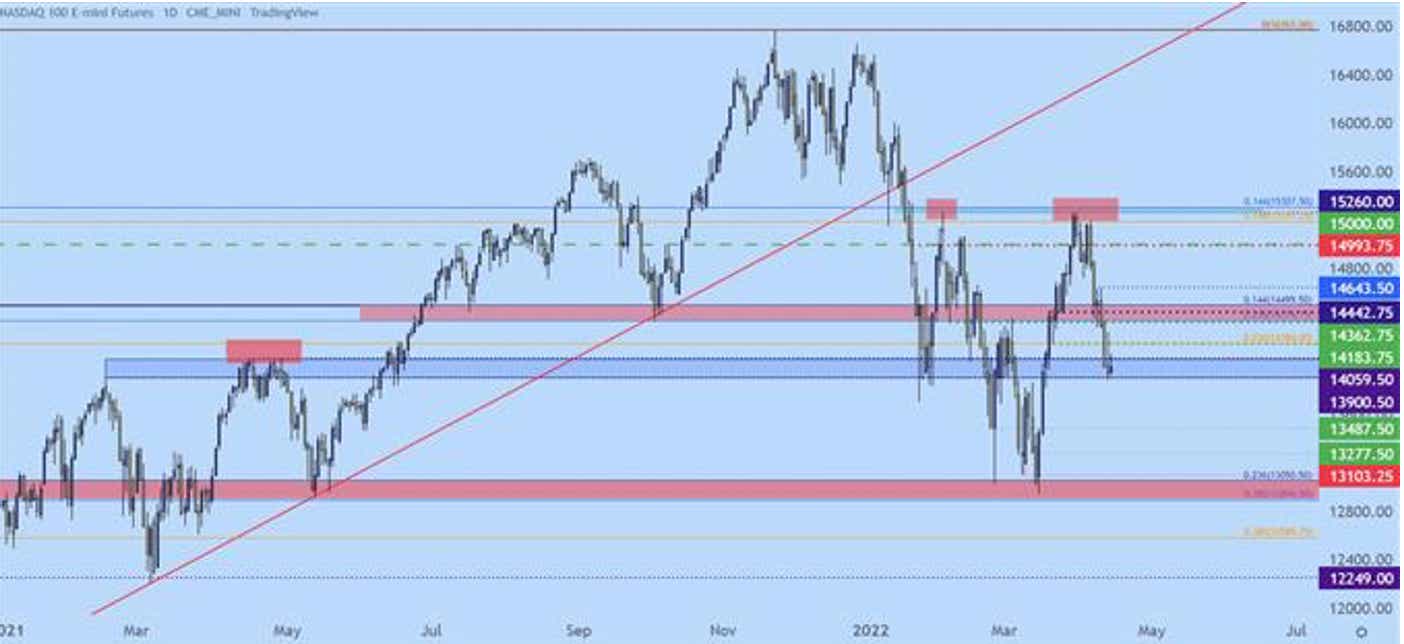
Chart prepared by James Stanley; Nasdaq 100 on Tradingview
DOW JONES
I have the Dow in what looks like the least bearish position of the three major US indices. But, that said, it also put in a less emphatic jump after the FOMC rate hike, gaining a more modest 8.3% v/s the 12% and change in the S&P and the near 18% in the Nasdaq 100.
At this point, the Dow is trying to hold support around prior resistance, taken from around 34,133-34,249. The recent pullback has shown in a somewhat orderly fashion, taking on the appearance of a falling wedge that’s playing as a short-term bull flag.
DOW JONES FOUR-HOUR PRICE CHART
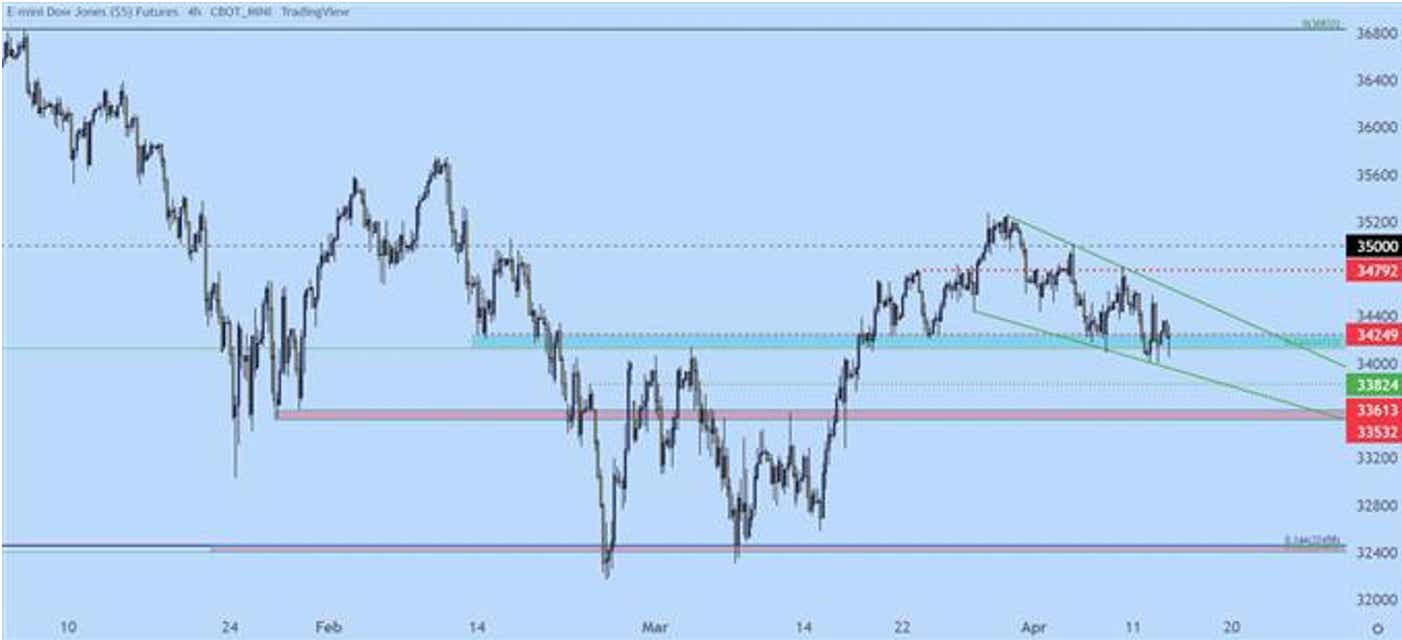
Chart prepared by James Stanley; Dow Jones on Tradingview
--- Written by James Stanley, Senior Strategist for DailyFX.com
Contact and follow James on Twitter: @JStanleyFX
Options involve risk and are not suitable for all investors. Please read Characteristics and Risks of Standardized Options before deciding to invest in options.
tastylive content is created, produced, and provided solely by tastylive, Inc. (“tastylive”) and is for informational and educational purposes only. It is not, nor is it intended to be, trading or investment advice or a recommendation that any security, futures contract, digital asset, other product, transaction, or investment strategy is suitable for any person. Trading securities, futures products, and digital assets involve risk and may result in a loss greater than the original amount invested. tastylive, through its content, financial programming or otherwise, does not provide investment or financial advice or make investment recommendations. Investment information provided may not be appropriate for all investors and is provided without respect to individual investor financial sophistication, financial situation, investing time horizon or risk tolerance. tastylive is not in the business of transacting securities trades, nor does it direct client commodity accounts or give commodity trading advice tailored to any particular client’s situation or investment objectives. Supporting documentation for any claims (including claims made on behalf of options programs), comparisons, statistics, or other technical data, if applicable, will be supplied upon request. tastylive is not a licensed financial adviser, registered investment adviser, or a registered broker-dealer. Options, futures, and futures options are not suitable for all investors. Prior to trading securities, options, futures, or futures options, please read the applicable risk disclosures, including, but not limited to, the Characteristics and Risks of Standardized Options Disclosure and the Futures and Exchange-Traded Options Risk Disclosure found on tastytrade.com/disclosures.
tastytrade, Inc. ("tastytrade”) is a registered broker-dealer and member of FINRA, NFA, and SIPC. tastytrade was previously known as tastyworks, Inc. (“tastyworks”). tastytrade offers self-directed brokerage accounts to its customers. tastytrade does not give financial or trading advice, nor does it make investment recommendations. You alone are responsible for making your investment and trading decisions and for evaluating the merits and risks associated with the use of tastytrade’s systems, services or products. tastytrade is a wholly-owned subsidiary of tastylive, Inc.
tastytrade has entered into a Marketing Agreement with tastylive (“Marketing Agent”) whereby tastytrade pays compensation to Marketing Agent to recommend tastytrade’s brokerage services. The existence of this Marketing Agreement should not be deemed as an endorsement or recommendation of Marketing Agent by tastytrade. tastytrade and Marketing Agent are separate entities with their own products and services. tastylive is the parent company of tastytrade.
tastycrypto is provided solely by tasty Software Solutions, LLC. tasty Software Solutions, LLC is a separate but affiliate company of tastylive, Inc. Neither tastylive nor any of its affiliates are responsible for the products or services provided by tasty Software Solutions, LLC. Cryptocurrency trading is not suitable for all investors due to the number of risks involved. The value of any cryptocurrency, including digital assets pegged to fiat currency, commodities, or any other asset, may go to zero.
© copyright 2013 - 2025 tastylive, Inc. All Rights Reserved. Applicable portions of the Terms of Use on tastylive.com apply. Reproduction, adaptation, distribution, public display, exhibition for profit, or storage in any electronic storage media in whole or in part is prohibited under penalty of law, provided that you may download tastylive’s podcasts as necessary to view for personal use. tastylive was previously known as tastytrade, Inc. tastylive is a trademark/servicemark owned by tastylive, Inc.