New Research: Big Market Moves Tend to Cluster

New Research: Big Market Moves Tend to Cluster
When a large gain or loss hits the markets, expect another one soon
In August and September 2024, the major market indices suffered sharp declines and high-magnitude fluctuations.
Big moves like these tend to cluster, with large swings triggering additional volatility
Understanding these patterns can help traders navigate turbulent markets and capitalize on emerging opportunities.
In both early August and early this month, the financial markets were shaken by sharp bouts of volatility, marked by several large market moves in quick succession. They’re examples of how high-magnitude market swings tend to cluster, particularly in major indices like the S&P 500 and Nasdaq Composite.
During the volatile stretch in August, the S&P 500 declined from 5,500 to nearly 5,100 in a matter of days—a loss of nearly 7%. Some days, the index fluctuated by more than 2%, underscoring the magnitude and frequency of these large moves. The Nasdaq Composite mirrored this pattern, shedding nearly 600 points during the same period.
The cluster early this month saw the S&P drop by more than 200 points in just a few days, reinforcing the pattern of clustered volatility and signaling continued turbulence.
Such moves aren’t anomalies; they’re a key feature of volatility clustering in financial markets. High-magnitude moves rarely happen in isolation. Instead, as the data from both early August and now early September illustrate, these moves tend to cluster, creating repeated periods of extreme turbulence.
Big daily moves
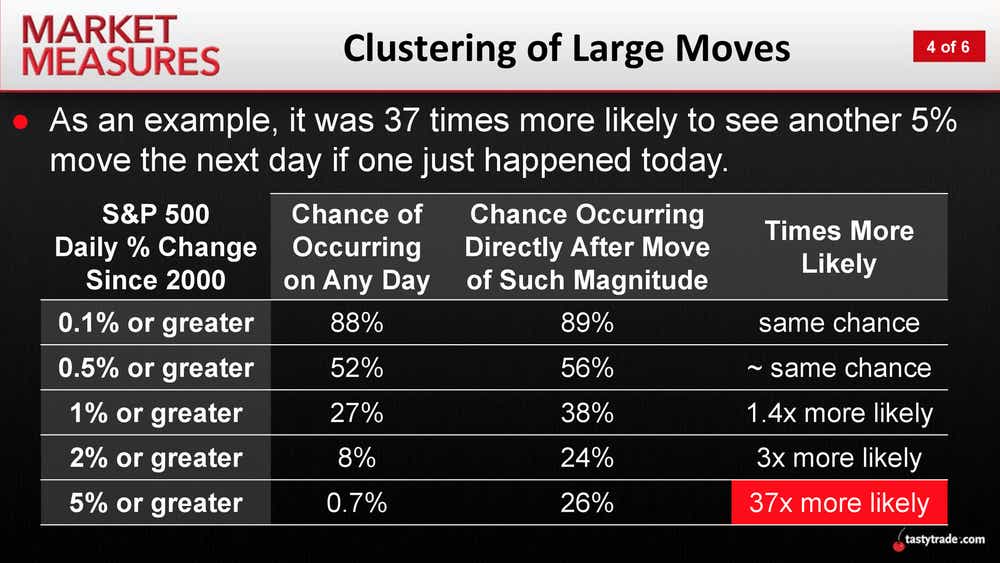
Historically, daily moves of 5% or more have been rare. Yet, when they do occur, they seldom happen in isolation. Research from tastylive shows once a 5% move occurs, the likelihood of another large move following soon after increases dramatically—by 37 times.

This phenomenon was clearly visible in early August 2024. While the magnitude of the moves didn’t quite reach the 5% threshold, the clustering of larger-than-average swings in both the S&P 500 and Nasdaq Composite was consistent with historical patterns.
Rama Cont’s research provides context. Cont observed that large changes in asset prices often exhibit a persistence in their amplitudes, meaning once a big move occurs, subsequent moves of similar magnitude tend to follow.
This clustering is driven by market mechanisms, including shifts between high and low activity regimes, and the behavior of market participants reacting to new information. As Cont noted, periods of intense market activity can endure, as large moves tend to perpetuate themselves instead of dissipating.
Smaller moves (those under 1%) behave differently, according to tastylive’s analysis. They’re more random and less predictable, lacking the clustering of larger market swings.
But when volatility spikes, and high-magnitude moves begin to cluster, the market shifts dramatically. In this heightened risk environment, traders not only face greater challenges but also a broader array of potentially lucrative opportunities as market dislocations become pronounced.
VIX amid big market moves
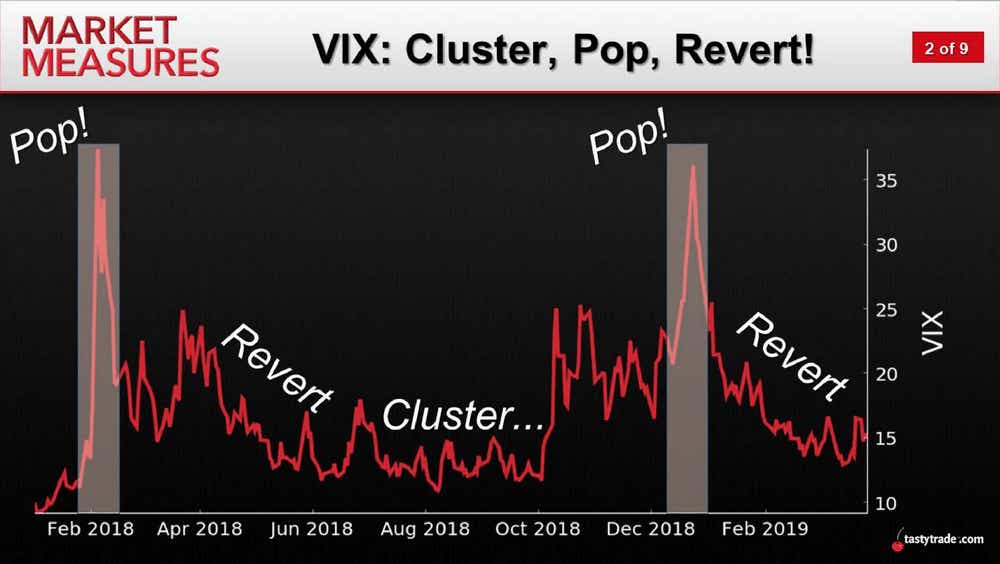
The CBOE Volatility Index (VIX), often referred called the “fear gauge,” also exhibited clustering in August 2024. After spending much of the summer at subdued levels, the VIX spiked in tandem with the sharp market moves, only to revert to lower levels as volatility subsided.
This behavior follows the well-documented "cluster, pop, revert" pattern highlighted by tastylive researchers. According to the pattern, the VIX tends to remain compressed during periods of market calm, pop aggressively during bouts of volatility and then slowly revert to its historical mean as markets stabilize.

In early August 2024, the VIX briefly surged above 30, before reverting to more typical levels of around 15. This cycle of compression, sudden spikes and reversion is not unique to 2024; it has played out repeatedly in recent years.
The research by Cont also reinforces this tendency. It found large price changes tend to persist and follow in clusters. Cont hypothesized this clustering is linked to switching between low and high activity regimes, driven by both market participants’ behavior and/or market-related news.
How long does elevated volatility last?
Investors often wonder how long periods of elevated volatility will persist. The time can vary greatly depending upon the duration of the initial surge.
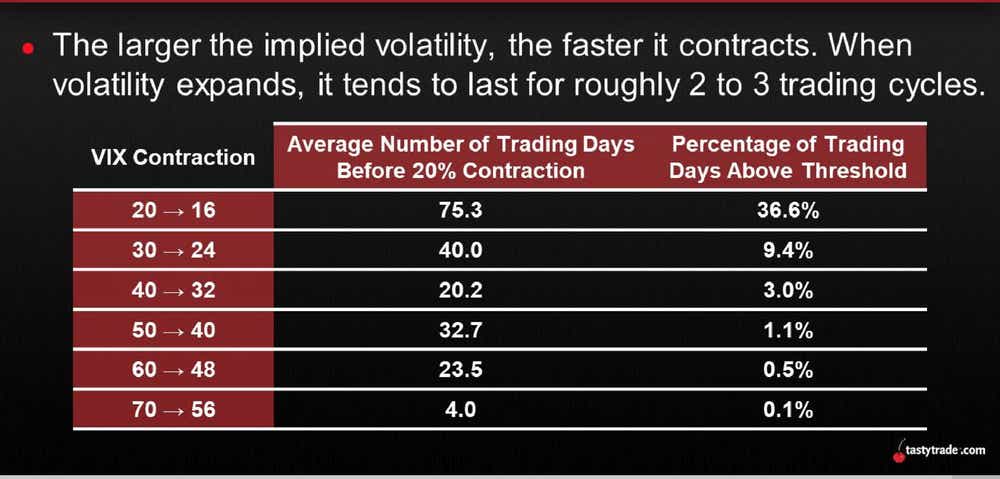
The VIX typically contracts by 20% in stages, with the time required for each contraction increasing as the VIX moves closer to its mean, according to tastylive research. For example, after the VIX spikes above 70, a 20% contraction (down to 56) has taken an average of just four trading days. However, once the VIX approaches its lower levels, the rate of contraction slows. A drop from 20 to 16, for instance, has taken an average of 75 trading days, as illustrated below.

Volatility may cool rapidly after sharp spikes, but the return to more stable conditions can be drawn out, especially as the VIX nears its historical mean. However, this data is more relevant to extended periods of volatility, such as those during the Financial Crisis of 2008-2009 or the pandemic-driven volatility of 2020.
In contrast, during August 2024, the VIX did not remain elevated for long and wasn’t extreme. That explains why the VIX decelerated relatively quickly. The index first spiked above 20 on Aug. 2, staying elevated for only seven trading days before closing below 20 on Aug. 13. Despite significant market swings, the VIX closed above 30 only once during this period, peaking at 38 on Aug. 5. Notably, the VIX has not closed above 40 since 2020.
Takeaways
The events of early August 2024 (and now again in early September) serve as a textbook example of how high-magnitude market moves can quickly snowball, leading to a cascade of large swings and sustained volatility. What began as isolated sharp fluctuations rapidly changed into a period of heightened turbulence, illustrating the tendency for large moves to cluster.
Research from tastyliveand Rama Cont reinforces the idea that volatility clustering is driven by market participant behavior. The persistence of these large moves is tied to factors such as investor reactions to new information, shifts in market regimes and, in Cont’s view, the inertia of market participants. Understanding these patterns is crucial because it opens the door for investors to exploit recurring opportunities during volatile periods.
As financial markets move through phases of extreme volatility, investors should stay alert to risks and opportunities that arise. By racking these large market moves and applying a well-researched strategy, traders can navigate volatile conditions and position themselves to capitalize on opportunities.
Andrew Prochnow has more than 15 years of experience trading the global financial markets, including 10 years as a professional options trader. Andrew is a frequent contributor of Luckbox Magazine.
For live daily programming, market news and commentary, visit tastylive or the YouTube channels tastylive (for options traders), and tastyliveTrending for stocks, futures, forex & macro.
Trade with a better broker, open a tastytrade account today. tastylive, Inc. and tastytrade, Inc. are separate but affiliated companies.
Options involve risk and are not suitable for all investors. Please read Characteristics and Risks of Standardized Options before deciding to invest in options.
tastylive content is created, produced, and provided solely by tastylive, Inc. (“tastylive”) and is for informational and educational purposes only. It is not, nor is it intended to be, trading or investment advice or a recommendation that any security, futures contract, digital asset, other product, transaction, or investment strategy is suitable for any person. Trading securities, futures products, and digital assets involve risk and may result in a loss greater than the original amount invested. tastylive, through its content, financial programming or otherwise, does not provide investment or financial advice or make investment recommendations. Investment information provided may not be appropriate for all investors and is provided without respect to individual investor financial sophistication, financial situation, investing time horizon or risk tolerance. tastylive is not in the business of transacting securities trades, nor does it direct client commodity accounts or give commodity trading advice tailored to any particular client’s situation or investment objectives. Supporting documentation for any claims (including claims made on behalf of options programs), comparisons, statistics, or other technical data, if applicable, will be supplied upon request. tastylive is not a licensed financial adviser, registered investment adviser, or a registered broker-dealer. Options, futures, and futures options are not suitable for all investors. Prior to trading securities, options, futures, or futures options, please read the applicable risk disclosures, including, but not limited to, the Characteristics and Risks of Standardized Options Disclosure and the Futures and Exchange-Traded Options Risk Disclosure found on tastytrade.com/disclosures.
tastytrade, Inc. ("tastytrade”) is a registered broker-dealer and member of FINRA, NFA, and SIPC. tastytrade was previously known as tastyworks, Inc. (“tastyworks”). tastytrade offers self-directed brokerage accounts to its customers. tastytrade does not give financial or trading advice, nor does it make investment recommendations. You alone are responsible for making your investment and trading decisions and for evaluating the merits and risks associated with the use of tastytrade’s systems, services or products. tastytrade is a wholly-owned subsidiary of tastylive, Inc.
tastytrade has entered into a Marketing Agreement with tastylive (“Marketing Agent”) whereby tastytrade pays compensation to Marketing Agent to recommend tastytrade’s brokerage services. The existence of this Marketing Agreement should not be deemed as an endorsement or recommendation of Marketing Agent by tastytrade. tastytrade and Marketing Agent are separate entities with their own products and services. tastylive is the parent company of tastytrade.
tastycrypto is provided solely by tasty Software Solutions, LLC. tasty Software Solutions, LLC is a separate but affiliate company of tastylive, Inc. Neither tastylive nor any of its affiliates are responsible for the products or services provided by tasty Software Solutions, LLC. Cryptocurrency trading is not suitable for all investors due to the number of risks involved. The value of any cryptocurrency, including digital assets pegged to fiat currency, commodities, or any other asset, may go to zero.
© copyright 2013 - 2025 tastylive, Inc. All Rights Reserved. Applicable portions of the Terms of Use on tastylive.com apply. Reproduction, adaptation, distribution, public display, exhibition for profit, or storage in any electronic storage media in whole or in part is prohibited under penalty of law, provided that you may download tastylive’s podcasts as necessary to view for personal use. tastylive was previously known as tastytrade, Inc. tastylive is a trademark/servicemark owned by tastylive, Inc.