Nasdaq 100 and US Indices Bleed Premium While VIX Hits 10 Month High as Risk Aversion Solidifies

Nasdaq 100 and US Indices Bleed Premium While VIX Hits 10 Month High as Risk Aversion Solidifies
S&P 500, Nasdaq 100, Dow, Risk Trends and Dollar Talking Points
- The Nasdaq 100 has carved out a head-and-shoulders pattern and the S&P 500 has broken its own while the options-derived VIX has cleared 30 to hit 10 month highs
- Full-blown risk aversion in December is unusual but not unprecedented; and the Dow’s heavier lean alongside the floundering of other ‘risk’ assets raises the threat
- Fed rate expectations are holding up thus far, but rate forecasts are unlikely to hold up to a market unwind – and the Dollar won’t just play ‘safe haven’ up front
The Technicals Get Serious on Risk Aversion
In general, I consider the major US indices to be among the best measures of ‘risk appetite’. It isn’t that these benchmarks are particularly sensitive to every ebb and flow in the collective confidence. In fact, they tend to be extraordinarily biased. There is a resiliency to the bullish mentality through the momentum-favored S&P 500, Dow and Nasdaq 100. However, that makes them even more interesting to me in that when these hold outs start to rollover in concert; it can speak even more meaningfully to capitulation. Everything is probability in my evaluation of the markets, and the chances of a reversal seem very small given the incredible persistence of the bull trend and the fact that December is historically a favorable month for speculative trends. However, there are outliers; and the backdrop of other risk assets has been eroding for more than a month while fresh fundamental concerns invade the headlines. So, I am on high alert for risk and opportunity. This past session alone, the persistence of volatility saw the S&P 500 open with the biggest gap higher in months, suffer the sharpest reversal lower (with biggest upper wick) in months and then an ultimate slide to the lowest level in 6 weeks. Next add on to bearish weight would a slide through the 100-day SMA at 4,485.
Chart of S&P 500 with Volume and Volume (Daily)
.jpg?format=pjpg&auto=webp&quality=50&width=915&disable=upscale)
Chart Created on Tradingview Platform
While the S&P 500 is the most heavily traded of the US indices as a benchmark general sentiment, there has been an even more aggressive bullish favorite in the post-pandemic run: the Nasdaq 100. The outperformance of tech shares relative to the broader US equity market has hit unprecedented levels – after taking out the NDX-Dow ratio record of the Dot-Com boom/bust era back in March 2000. In fact, that same ratio surged even higher this past session as a side effect of the sheer volatility. Yet, if we are committing to a true unwind, the tech index has more premium to shed and I would expect it to fall further and faster…if we are indeed reversing. Therefore, watching this Nasdaq 100 head-and-shoulders pattern post a break and follow through and then the 15,000 mark as a critical trendline and ‘technical correction’ (-10 percent form all time high) will be critical escalation for a sentiment escalation difficult to foster this late in the year.
Chart of Nasdaq to Dow Ratio Overlaid with the Dow Jones Industrial Average (Daily)
.jpg?format=pjpg&auto=webp&quality=50&width=915&disable=upscale)
Chart Created on Tradingview Platform
Ultimately, ‘risk trends’ is far more vast a concept than just one or two US indices – and beyond the US equities realm of influence overall. However, in measuring that breadth, there are the hold outs that carry a lot of more heft in the speculative hierarchy. There is excess premium in the NDX and even SPX such that they can be considered more outliers that can suffer a decline without it capsizing all of the financial system. The Dow is a little different in that calculus. The blue chip index started to fade away from its counterparts a few weeks ago, and now it is truly starting to hit serious technical milestones. Not only was this past session’s slide a big one, but it is getting close to taking out a major support of the past four months and closed below the 200-day SMA for the first time in 337 trading days. Next stop is the full 34,000 break and then the ‘technical correction’ down around 33,000.
Chart of Nasdaq to Dow Ratio Overlaid with the Dow Jones Industrial Average (Daily)
_.jpg?format=pjpg&auto=webp&quality=50&width=915&disable=upscale)
Chart Created on Tradingview Platform
The Threshold of a Full Capitulation in ‘Risk Trends’
Ultimately, I am a skeptic such that even my bearish interpretation of ‘value’ will not lead me to just jump head first into an out-of-season risk aversion. I want to see a broad scope of risk aversion across the world and across asset types. That said, we have seen the markets outside US equities losing ground for some weeks. In assessing when you establish where your individual confidence flips to conviction, it is important to have a milestone/s for which you feel it is time to unwind risk exposure or to take a speculative short position. I am still more short-term oriented with tactical shorts intended only for days. However, should all the major US indices take out the aforementioned support levels, I will be willing to take a market view that runs against convention of both speculative trends and liquidity.
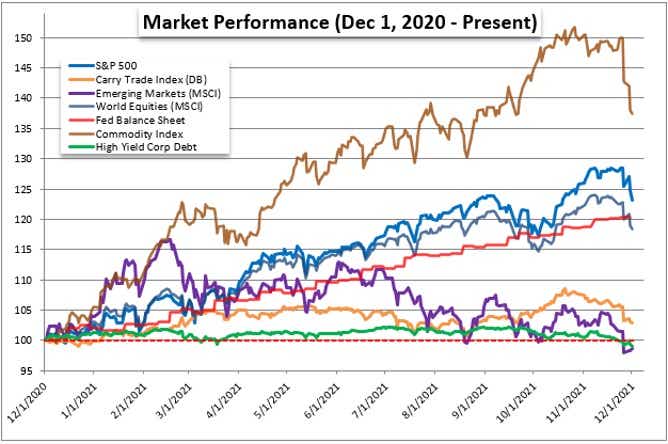
Chart of S&P 500 Monthly Performance, Volume and Volatility

Chart Created on John Kicklighter with Data from Bloomberg
The Dollar is a Critical Signal and ‘Other’ Event Risk for Justifying a Sentiment View
When it comes to evaluating the full scope of market conviction, another very useful measure for the macro observer is the US Dollar. The so-called Greenback is historically considered a ‘safe haven’, but it is probably a poor measure of this systemic theme through the uncertain, transitive period. While the currency (via Treasuries and money market accounts) is a ‘haven of last resort’, it takes time to get to that severe level of panic. The first move in risk aversion is to first unwind risky positions. After the past few weeks of interest rate speculation building up, the US currency has been inflated by carry trade interest that puts it more on the risk side. In fact, the 20-day correlation between the DXY and US 2-year yield for interest rate expectations (below) is far stronger than its negative correlation to the S&P 500 (as risk). Notably, Fed rate forecasts didn’t collapse this past session with the sentiment slump; but if the later theme persists, the rate view and Dollar will not hold out.
Chart of DXY Dollar Index and US 2-Year Treasury Yield with 20-Day Correlation (Daily)
.jpg?format=pjpg&auto=webp&quality=50&width=732&disable=upscale)
Chart Created on Tradingview Platform
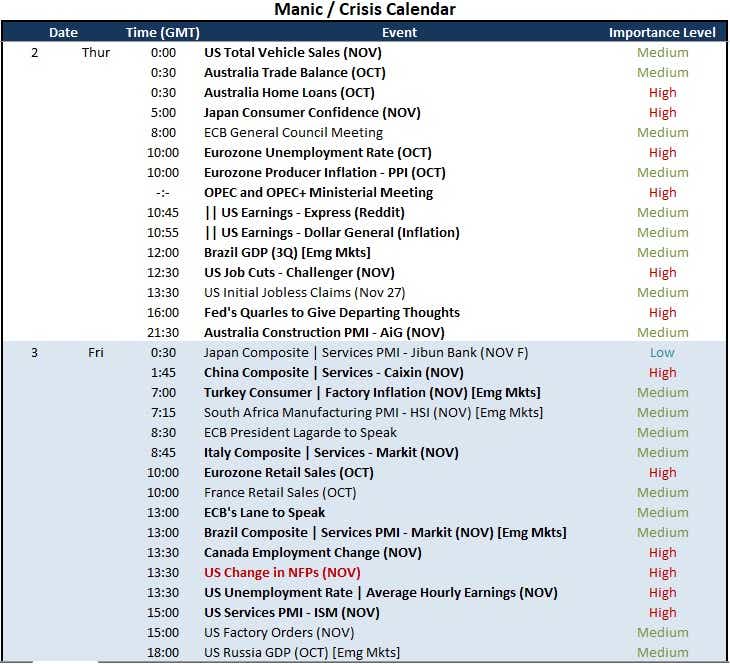
As we find the market with a heighted sense of fear over the path of risk trends moving forward, expect fundamental troubles – both scheduled and unscheduled – to represent additional logs on the sentiment bonfire. In data terms, there is targeted potential in earnings (Express and Dollar General), the OPEC summit and Brazilian GDP, not to mention the anticipation of Friday’s NFPs. However, I am more concerned about the uncertain potential around the latest US debt ceiling risk. The probability that the government would allow such a catastrophic event as a technical default is low, but the impact is so severe that we cannot ignore it. This is what we would call a ‘grey swan’.
Calendar of Major Macro Event Risk Through Week End

Calendar Created by John Kicklighter
Options involve risk and are not suitable for all investors. Please read Characteristics and Risks of Standardized Options before deciding to invest in options.
tastylive content is created, produced, and provided solely by tastylive, Inc. (“tastylive”) and is for informational and educational purposes only. It is not, nor is it intended to be, trading or investment advice or a recommendation that any security, futures contract, digital asset, other product, transaction, or investment strategy is suitable for any person. Trading securities, futures products, and digital assets involve risk and may result in a loss greater than the original amount invested. tastylive, through its content, financial programming or otherwise, does not provide investment or financial advice or make investment recommendations. Investment information provided may not be appropriate for all investors and is provided without respect to individual investor financial sophistication, financial situation, investing time horizon or risk tolerance. tastylive is not in the business of transacting securities trades, nor does it direct client commodity accounts or give commodity trading advice tailored to any particular client’s situation or investment objectives. Supporting documentation for any claims (including claims made on behalf of options programs), comparisons, statistics, or other technical data, if applicable, will be supplied upon request. tastylive is not a licensed financial adviser, registered investment adviser, or a registered broker-dealer. Options, futures, and futures options are not suitable for all investors. Prior to trading securities, options, futures, or futures options, please read the applicable risk disclosures, including, but not limited to, the Characteristics and Risks of Standardized Options Disclosure and the Futures and Exchange-Traded Options Risk Disclosure found on tastytrade.com/disclosures.
tastytrade, Inc. ("tastytrade”) is a registered broker-dealer and member of FINRA, NFA, and SIPC. tastytrade was previously known as tastyworks, Inc. (“tastyworks”). tastytrade offers self-directed brokerage accounts to its customers. tastytrade does not give financial or trading advice, nor does it make investment recommendations. You alone are responsible for making your investment and trading decisions and for evaluating the merits and risks associated with the use of tastytrade’s systems, services or products. tastytrade is a wholly-owned subsidiary of tastylive, Inc.
tastytrade has entered into a Marketing Agreement with tastylive (“Marketing Agent”) whereby tastytrade pays compensation to Marketing Agent to recommend tastytrade’s brokerage services. The existence of this Marketing Agreement should not be deemed as an endorsement or recommendation of Marketing Agent by tastytrade. tastytrade and Marketing Agent are separate entities with their own products and services. tastylive is the parent company of tastytrade.
tastycrypto is provided solely by tasty Software Solutions, LLC. tasty Software Solutions, LLC is a separate but affiliate company of tastylive, Inc. Neither tastylive nor any of its affiliates are responsible for the products or services provided by tasty Software Solutions, LLC. Cryptocurrency trading is not suitable for all investors due to the number of risks involved. The value of any cryptocurrency, including digital assets pegged to fiat currency, commodities, or any other asset, may go to zero.
© copyright 2013 - 2025 tastylive, Inc. All Rights Reserved. Applicable portions of the Terms of Use on tastylive.com apply. Reproduction, adaptation, distribution, public display, exhibition for profit, or storage in any electronic storage media in whole or in part is prohibited under penalty of law, provided that you may download tastylive’s podcasts as necessary to view for personal use. tastylive was previously known as tastytrade, Inc. tastylive is a trademark/servicemark owned by tastylive, Inc.