Dow, S&P 500, Nasdaq 100 Forecasts: Stuck at Support for Lift-Off

Dow, S&P 500, Nasdaq 100 Forecasts: Stuck at Support for Lift-Off
DOW, S&P 500, NASDAQ 100 TALKING POINTS:
- The big week is here with the FOMC on Wednesday, widely-expected to bring the first hike since 2018.
- A 25 basis point hike is baked in here, more pressing will be what else the Fed says and this is where the forecasts can take on special importance, highlighting how the FOMC expects inflation to react in the coming months, along with their expectation for rate policy moving forward. Also of issue is Quantitative Tightening and how the FOMC is going to handle the massive portfolio that’s been accumulated at the bank.
- The analysis contained in article relies on price action and chart formations. To learn more about price action or chart patterns, check out our DailyFX Education section.
Fed week is finally here and this is the rate decision that’s been circled on the economic calendar for quite some time, as the FOMC is expected to hike rates for the first time since 2018. The bank has instituted a number of stimulus programs since that last hike in December four years ago, and at this point inflation continues to run-higher which will likely necessitate more tightening out of the Fed throughout this year.
The big question at this point is how much additional tightening will be necessary, and this is a question that’s clouded with opacity at the moment. While the Fed continued to ignore inflation last year under the presumption that it was ‘transitory,’ inflation has only continued to grow, illustrated by that 7.9% print from last week, setting another fresh 40-year high.
And as covered in this week’s equity forecast, there’s potential for even more inflation as a number of raw materials have spiked since the sanctions imposed on Russia after their invasion of Ukraine. This could serve to put the Fed even deeper into a corner, with even stronger inflation rates that necessitate much more tightening to tame. In response, the yield curve has seen some very fast compression, with the 2/10 Treasury spread at its tightest since 2019, just ahead of the pandemic. Notably, this indicator has inverted three times in the past 20 years, the first two of which occurred in front of the tech bust and then the global financial collapse.
This is a bearish signal and it’ll often show up ahead of recessions. The fact that investors and funds will take a lower rate of return for a longer-term of investment highlights distortion, along with some pessimism from professional investors. Those investors on the long end of the curve might not even be looking to hold the investment to term, but there’s motivation to play the principal pop on the expectation that rates will drop and bond values on the long end of the curve will see some appreciation as rates go down.
US TREASURY 2/10 YIELD CURVE SPREAD
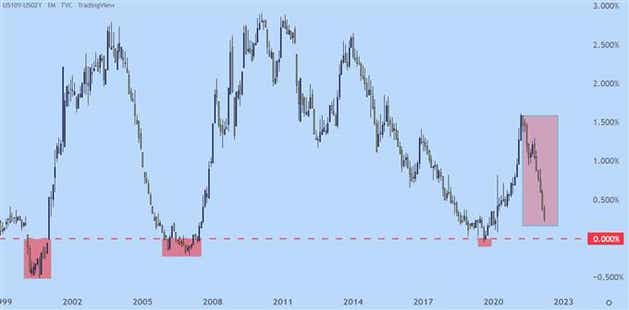
Chart prepared by James Stanley; S&P 500 on Tradingview
S&P 500
At this point the S&P 500 is holding support at a key spot on the chart, around the January lows and just a bit-higher than the February lows. There’s a confluence of Fibonacci supports from 4186-4211 that’s been helping to buoy price near the lows over the past couple of months and that’s in-play to start the week. This could be a challenging area to sell at given the series of higher-lows and the tendency for buyers to show in that zone.
S&P 500 FOUR-HOUR PRICE CHART
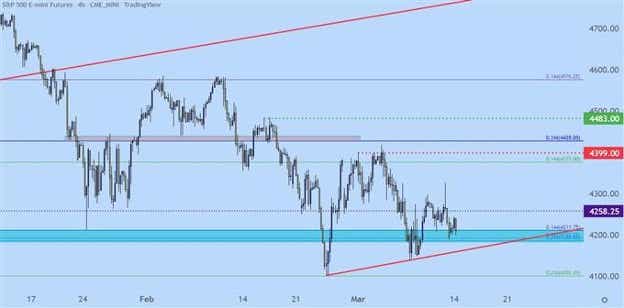
Chart prepared by James Stanley; S&P 500 on Tradingview
S&P BIGGER PICTURE
Taking a step back highlights the importance of this support zone. The Fibonacci level at 4101 helped to catch the February low and at this point, that constitutes the 10-month low in the index. A breach of that support opens the door for a run down to the 4k level, where a Fibonacci level is confluent with the psychological level.
And below that is a mass of support around the 3800 level, and a run down there would mark the total sell-off from the January high at just beyond 20%, marking ‘bear market’ territory for the S&P 500. This would be around the area that I’d look for a bounce, especially if this zone comes into play quickly from a bearish breakout.
S&P 500 DAILY PRICE CHART
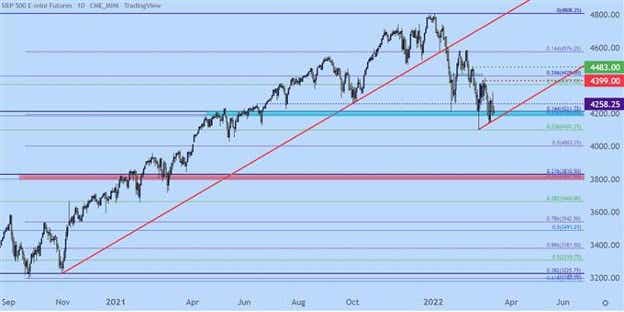
Chart prepared by James Stanley; S&P 500 on Tradingview
NASDAQ 100
There’s a similar setup in the Nasdaq 100 right now, with prices posturing near support that’s so far proven stubborn and difficult to break. The decline from the prior high has been more pronounced, however, as the Nasdaq 100 is technically in ‘bear market’ territory already.
The support of note in the Nasdaq 100 is between Fibonacci levels at 12,894 and 13,050, the latter of which is currently helping to mark the 10-month low in the index.
NASDAQ 100 FOUR-HOUR PRICE CHART
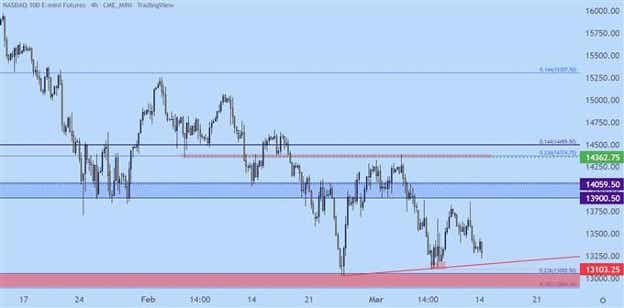
Chart prepared by James Stanley; Nasdaq 100 on Tradingview
NASDAQ LONGER-TERM
Taking a step back on the chart highlights the importance of this zone. A breach of this support opens the door for a move down to next support, around 12,250 on my chart which would mark a fresh yearly low in the Nasdaq 100. Below that, around 11,700 is another key spot as this is the 50% marker of the pandemic move in the index, taken from the low in March of 2020 up to the high in November of last year.
NASDAQ 100 WEEKLY PRICE CHART
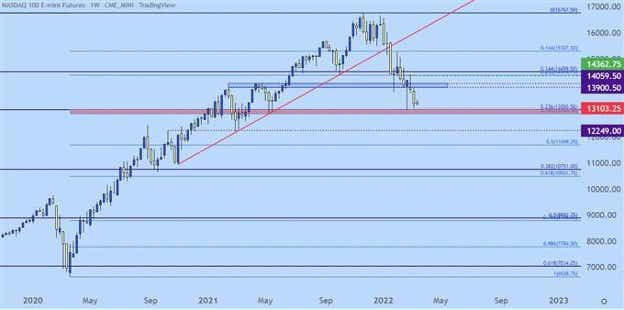
Chart prepared by James Stanley; Nasdaq 100 on Tradingview
DOW DIVERGENCE
As the Nasdaq 100 trades in ‘bear market territory’ as the S&P 500 gets closer and closer to the same, the Dow has held up fairly well, all factors held equal. There’s a confluent spot of support around 32,500 that’s held the lows over the past few weeks and the index is still around 11% from its prior all-time-high.
DOW JONES WEEKLY PRICE CHART
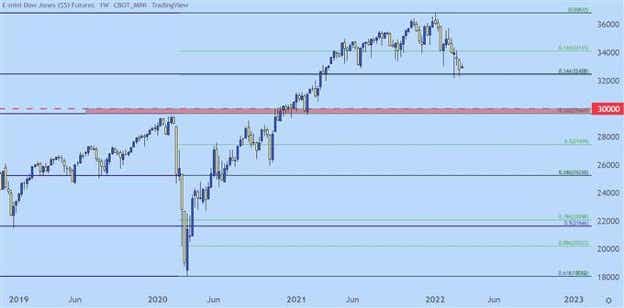
Chart prepared by James Stanley; Dow Jones on Tradingview
DOW JONES SHORTER-TERM
The Dow is exhibiting a similar pattern of digestion over the past few weeks as a key spot of longer-term support has come into play. If that support is breached, however, there could be a large move in store as the next major spot of support on my chart is around the 30k psychological level.
There is a zone of short-term resistance that, if tested through, could quickly open the door for bullish scenarios. That resistance is from a spot of prior swing support and spans from around 33,532 up to 33,613, and this is the area that caught last week’s swing high.
A push through this zone opens the door for bigger picture bullish reversal potential.
DOW JONES FOUR-HOUR PRICE CHART
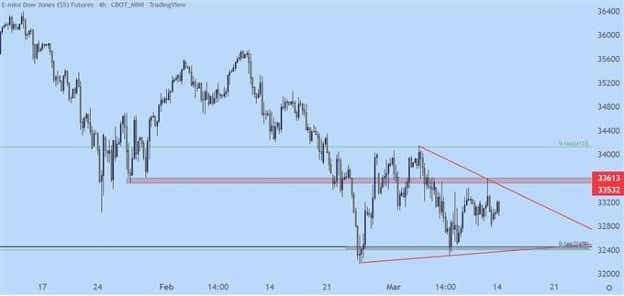
Chart prepared by James Stanley; Dow Jones on Tradingview
- Written by James Stanley, Senior Strategist for DailyFX.com
Contact and follow James on Twitter: @JStanleyFX
Options involve risk and are not suitable for all investors. Please read Characteristics and Risks of Standardized Options before deciding to invest in options.
tastylive content is created, produced, and provided solely by tastylive, Inc. (“tastylive”) and is for informational and educational purposes only. It is not, nor is it intended to be, trading or investment advice or a recommendation that any security, futures contract, digital asset, other product, transaction, or investment strategy is suitable for any person. Trading securities, futures products, and digital assets involve risk and may result in a loss greater than the original amount invested. tastylive, through its content, financial programming or otherwise, does not provide investment or financial advice or make investment recommendations. Investment information provided may not be appropriate for all investors and is provided without respect to individual investor financial sophistication, financial situation, investing time horizon or risk tolerance. tastylive is not in the business of transacting securities trades, nor does it direct client commodity accounts or give commodity trading advice tailored to any particular client’s situation or investment objectives. Supporting documentation for any claims (including claims made on behalf of options programs), comparisons, statistics, or other technical data, if applicable, will be supplied upon request. tastylive is not a licensed financial adviser, registered investment adviser, or a registered broker-dealer. Options, futures, and futures options are not suitable for all investors. Prior to trading securities, options, futures, or futures options, please read the applicable risk disclosures, including, but not limited to, the Characteristics and Risks of Standardized Options Disclosure and the Futures and Exchange-Traded Options Risk Disclosure found on tastytrade.com/disclosures.
tastytrade, Inc. ("tastytrade”) is a registered broker-dealer and member of FINRA, NFA, and SIPC. tastytrade was previously known as tastyworks, Inc. (“tastyworks”). tastytrade offers self-directed brokerage accounts to its customers. tastytrade does not give financial or trading advice, nor does it make investment recommendations. You alone are responsible for making your investment and trading decisions and for evaluating the merits and risks associated with the use of tastytrade’s systems, services or products. tastytrade is a wholly-owned subsidiary of tastylive, Inc.
tastytrade has entered into a Marketing Agreement with tastylive (“Marketing Agent”) whereby tastytrade pays compensation to Marketing Agent to recommend tastytrade’s brokerage services. The existence of this Marketing Agreement should not be deemed as an endorsement or recommendation of Marketing Agent by tastytrade. tastytrade and Marketing Agent are separate entities with their own products and services. tastylive is the parent company of tastytrade.
tastycrypto is provided solely by tasty Software Solutions, LLC. tasty Software Solutions, LLC is a separate but affiliate company of tastylive, Inc. Neither tastylive nor any of its affiliates are responsible for the products or services provided by tasty Software Solutions, LLC. Cryptocurrency trading is not suitable for all investors due to the number of risks involved. The value of any cryptocurrency, including digital assets pegged to fiat currency, commodities, or any other asset, may go to zero.
© copyright 2013 - 2025 tastylive, Inc. All Rights Reserved. Applicable portions of the Terms of Use on tastylive.com apply. Reproduction, adaptation, distribution, public display, exhibition for profit, or storage in any electronic storage media in whole or in part is prohibited under penalty of law, provided that you may download tastylive’s podcasts as necessary to view for personal use. tastylive was previously known as tastytrade, Inc. tastylive is a trademark/servicemark owned by tastylive, Inc.